Carmel River Watershed: Potero, Pine and Garzas Creeks Flow Duration Analysis

Hydrologic Setting
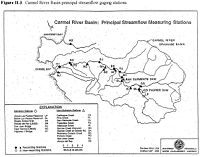
The Carmel River begins in the Santa Lucia Mountains, flowing northwest through the Carmel Valley and drains into the Carmel Lagoon and eventually the ocean at Carmel State Beach[2]. There is a strong precipitation gradient within the watershed with most of the rain falling in the southern portion in the mountains and less near the mouth of the river at lower elevations[3]. There are two dams in the watershed. The first dam is the San Clemente dam, built in 1921 for the storage of drinking water and flood control. Los Padres dame was built in 1949 to try and slow the loss of capacity in San Clemente dam due to sedimentation. As the Carmel River runs through the Carmel Valley it supplies water to the Carmel Aquifer. This aquifer is the major source of water for the towns of Carmel-by-the-sea, Pebble Beach, Pacific Grove, Monterey and parts of Seaside. The Carmel River and Carmel Lagoon are some of the best remaining steelhead habitat on the central California Coast. Attempting to manage the watershed as a source of municipal water and steelhead habitat has caused it to be one of the most monitored watersheds in central California. There is an extensive network of flow gauges between the US Geological Survey and Monterey Peninsula Water Management District.
Pine, Garzas and Potrero Creek are three tributaries to the main stem of the Carmel River. Pine Creek is the first gauged tributary with a north draining watershed. It enters the river in the upper portion of watershed between the Los Padres and San Clemente dams. Garzas Creek is also a north draining watershed and enters the river below the USGS gauge at Robles del Rio (Rosie's bridge)[4] and above the MPWMD gauge at Don Juan bridge[4]. Potrero Creek is the southern-most north draining gauged watershed and enters the river very near the downstream USGS gauge near Carmel[4]. This analysis addresses only tributaries with north draining watersheds because they all have their headwaters in the wetter southern portion of the watershed.
Analysis
Each curve is relatively smooth indicative of un-managed watersheds. All three of the tributaries have gone dry sometime between 1992 and 2008.
Pine creek is only dry in drought years[5] with flow being recorded at the site for roughly 92% of the time. The flow at the lower and upper end has a distinctive step pattern. This is most likely simply due to the resolution of the gaging system at very low flows.[6]
Garzas Creek is dry about 49% of the time and Potrero Creek is dry 30% of the time. These differences are examined in terms of the influence of precipitation, basin size, and geology as follows:
- Precipitation. The flow duration of these three tributaries correlates well with the precipitation gradient of the watershed. Pine Creek receives the most precipitation and flows the longest during the year. Potrero Creek receives the least precipitation and flows the least. Garzas falls somewhere in the middle.
- Basin size. No correction was made for basin size (watershed area) so as to reveal whether basin size would over-ride the influence of the precipitation gradient. Garzas Creek has the largest watershed area and extends well into the Santa Lucia Mountains but is dry an additional 45% of the time compared with Pine Creek. If basin size was the dominant control on flow duration, it could have been expected that Garzas Creek would flow for longer periods of time than the other tributaries.
- Geology. The geology differs between the three tributaries. Pine Creek flows through areas of mostly rock outcrop[7] while Garzas and Potrero Creek Watersheds exhibit more porous substrates. Garzas and Potrero Creek lose water to the aquifer more then Pine Creek. This causes them to have shorter flow durations.
Summary
The precipitation gradient and geology are the dominant controls on flow duration of the north facing tributaries to the Carmel River.
Notes and References
- ↑ Potrero is spelled wrong in the legend of this graph
- ↑ Maps of the Carmel River Watershed
- ↑ Carmel River Watershed: Map of Precipitation
- ↑ 4.0 4.1 4.2 California Central Coast Gage Locations
- ↑ This cannot be inferred from the FDC. Is the information based on the flow record directly?
- ↑ A three month period occurred in the record when low flows were estimated. From June through December of 1994 the flow was estimated with nearly all of August and September being estimated at 0.01 cfs. The data record almost a month of every year flowing at 0.01 cfs before going dry.
- ↑ Is this correct? Reference needed
- CSUMB-CCoWS Carmel Watershed Assessment
- Image:Carmel_Watershed_Precipitation.png|Precipitation
- Image:Geol.Fault.Map.png|Geology
Links
- The Carmel River Watershed: http://ccows.csumb.edu/pubs/maps/crwa/Poster/Carmel_Map1-2_36x44.pdf
- The network of USGS and MPWMD gauges:
- Carmel River Watershed: Flow Duration Analyses
