Carmel River Watershed: Pine and Cachagua Creeks Flow Duration Analysis
Hydrologic setting
Pine & Cachagua Creeks are tributaries of the Carmel River and are located upstream from the San Clemente Dam in the upper Carmel River Watershed[1]. Pine Creek winds its way along the base of a steep, high-walled and narrow watershed that receives 500 - 1000 mm/yr in average annual precipitation. Cachuaga Creek, while approximately the same length as Pine Creek, flows through a much flatter, lower-elevation watershed and only receives 500-700 mm/yr in average annual precipitation. The geology of Pine Creek is highlighted by quartz diorite and gneiss while Cachagua Creek is lined with flood plain and sandstone deposits.[2] The confluence of Pine Creek with the Carmel River is a site of a California Department of Fish & Game (CDFG) project to improve steelhead spawning habitat[3][4]. Due to sediment deposits and cattle grazing within the sub-watershed, Cachuaga Creek has been assessed as functioning-at risk with potential for impairment or dysfunction.[5]
Analysis
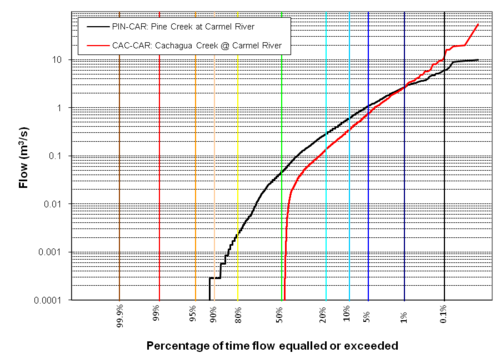
Flow duration curves (FDCs) are given for both Pine and Cachagua Creeks at their confluences with the Carmel River. The FDCs demonstrates that Pine Creek flows over 90% of the time while Cachagua Creek flows less than 50% of the time. The general smoothness of both FDCs is indicative of an unregulated flow regime i.e. there does not appear to any regulation system upstream that would cause any particular flows rates to be more common than slightly higher or lower flow rates.
Relative to the smooth curve expected of an unregulated stream, steeper parts of the curve correspond to relatively uncommon flows, and flatter parts of the curve correspond to relatively common flows. Pine Creek's curve has almost constant steepness and does not seem to flatten out. Cachagua Creek's curve is less steep than Pine Creek, but indicates that it does not flow more than 50% of the time.
Comparing the two curves, Cachagua Creek's highest flows (>10 CMS) are higher than the highest flows Pine Creek.[6] Vice versa, during the lower flow periods, Pine Creek carries more flow than Cachuaga Creek, which flows less than 50% of the time. The higher precipitation and steepness of Pine Creek watershed may result in consistent flow in during the summer months, while the larger watershed and tributaries of Cachagua Creek result in higher extreme level flow (>10 CMS). Also possible is that some flow is diverted from Cachagua Creek at lower flow levels or diverted from Pine Creek at higher flow levels. Perhaps the more porous sandstone and flood deposits beneath Cachagua Creek contribute to more infiltration and reducing flow. Pine Creek's more impermeable diorite and gneiss geology, on the other hand, result in more precipitation being converted to outflow.
Summary
Based on visual comparison of flow duration curves, Pine Creek and Cachagua Creeks demonstrate:
- Effects of watershed area, watershed elevation (and thus precipitation), and watershed steepness on flow
- Geology impacting infiltration and flow
References
- ↑ Carmel River Basin: Principle Stream flow measuring locations

- ↑ [Maps of the Carmel River Watershed]
- ↑ CDFG Improve Steelhead Passage: Pine Creek Confluence Project Description: http://www.ice.ucdavis.edu/nrpi/NRPIDescription.asp?ProjectPK=7182
- ↑ Natural Resource Projects Inventory Report: http://www.ice.ucdavis.edu/nrpi_docs/pdf/nrpi-07182.pdf
- ↑ Carmel River Watershed Conservancy [[1]]
- ↑ Is this simply because of a difference in watershed area? Cachagua is much larger than Pine isn't it?
