Difference between revisions of "Carmel River Watershed: Map of Precipitation"
From CCoWS Wiki
| Line 9: | Line 9: | ||
* Original source of data: [[http://www.prism.oregonstate.edu/products/matrix.phtml?vartype=tmax&view=data http://www.prism.oregonstate.edu/products/matrix.phtml?vartype=tmax&view=data]] | * Original source of data: [[http://www.prism.oregonstate.edu/products/matrix.phtml?vartype=tmax&view=data http://www.prism.oregonstate.edu/products/matrix.phtml?vartype=tmax&view=data]] | ||
* Full metadata available from: [[http://www.prism.oregonstate.edu/docs/meta/ppt_30s_meta.htm http://www.prism.oregonstate.edu/docs/meta/ppt_30s_meta.htm]] | * Full metadata available from: [[http://www.prism.oregonstate.edu/docs/meta/ppt_30s_meta.htm http://www.prism.oregonstate.edu/docs/meta/ppt_30s_meta.htm]] | ||
| − | * Data | + | * Data analysis: Cropped from national scale to just California Coast by [[Fred Watson]], in Arc ASCII GRID format. |
* Map produced by: | * Map produced by: | ||
* Base map compiled by Erin Stanfield, [[Fred Watson]], Wendi Newman. | * Base map compiled by Erin Stanfield, [[Fred Watson]], Wendi Newman. | ||
Latest revision as of 08:35, 6 February 2011
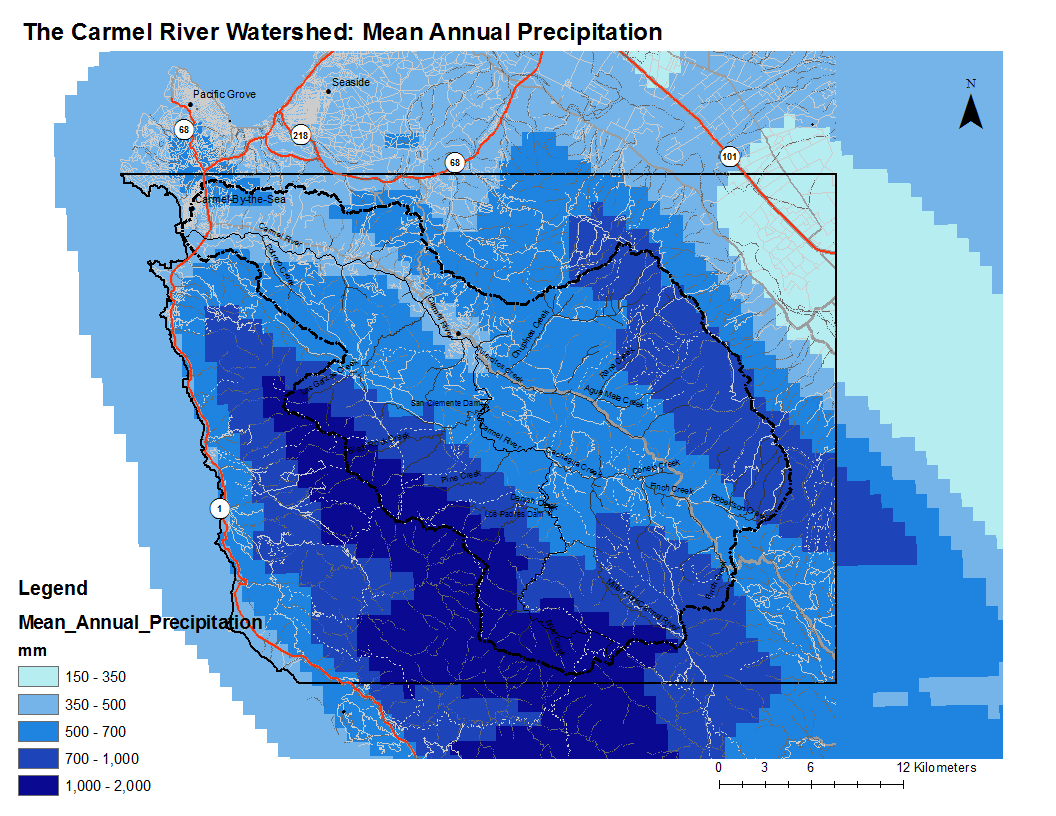
Mean Annual Precipitation

Metadata
- Original source of data: [http://www.prism.oregonstate.edu/products/matrix.phtml?vartype=tmax&view=data]
- Full metadata available from: [http://www.prism.oregonstate.edu/docs/meta/ppt_30s_meta.htm]
- Data analysis: Cropped from national scale to just California Coast by Fred Watson, in Arc ASCII GRID format.
- Map produced by:
- Base map compiled by Erin Stanfield, Fred Watson, Wendi Newman.
- Base map:
- Projected Coordinate System: NAD_1983_UTM_Zone_10N
- Projection: Transverse_Mercator
- Projected Coordinate System: NAD_1983_UTM_Zone_10N
- Precipitation map:
- Geographic Coordinate System: GCS_North_American_1983
- Datum: D_North_American_1983
- Prime Meridian: Greenwich
- Geographic Coordinate System: GCS_North_American_1983
Processing Steps
- Convert ASCII grid file to Raster using Conversion Tools and Define projection.
- Add Raster to Base map and Symbolize annual precipitation means using categories with rounded natural breaks.
- Select appropriate color scheme.
Alternate versions
- A version with isohyets overlaid on a DEM is here: Carmel River Watershed: Map of Precipitation 2