Difference between revisions of "Carmel River Watershed: Don Juan Bridge to Highway 1 Flow Duration Analysis"
| Line 1: | Line 1: | ||
| − | The Y-axis on the graph below is incorrect. | + | The Y-axis on the graph below is incorrect, and the references in the text to specific flows are thus also incorrect. |
[[Image:FDC_sq.png|600px]] | [[Image:FDC_sq.png|600px]] | ||
| Line 15: | Line 15: | ||
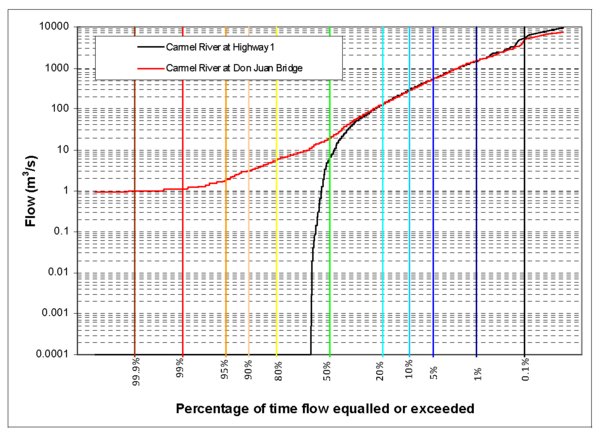
Comparing the two curves, the Don Juan Bridge flow and Highway 1 flow have nearly equal duration curves with periods of very high flow ( >100 m3/s). There is a significant separation between both curves in periods of low flow (<100 m3/s). There is also a slight separation during anomalously high flow periods ( >3000 m3/s ). These observations in combination indicate either: | Comparing the two curves, the Don Juan Bridge flow and Highway 1 flow have nearly equal duration curves with periods of very high flow ( >100 m3/s). There is a significant separation between both curves in periods of low flow (<100 m3/s). There is also a slight separation during anomalously high flow periods ( >3000 m3/s ). These observations in combination indicate either: | ||
| − | # | + | # Low to medium flows at Don Juan are lost in the lower reaches (i.e. to infiltration and aquifer recharge) |
| − | # | + | # The lower watershed below San Juan only contributes a net increase to the flow during very high flows (<1% of the time) |
| − | The lower Carmel River goes dry annually due to heavy infiltration of surface waters to replace groundwater in the Carmel aquifer which is pumped for municipal use. The continuous flow of the Carmel River at the Don Juan Bridge | + | The lower Carmel River goes dry annually due to heavy infiltration of surface waters to replace groundwater in the Carmel aquifer which is pumped for municipal use. The continuous flow of the Carmel River at the Don Juan Bridge may indicate a source of flow that is unrelated to direct storm runoff, such as baseflow from groundwater, or summer low-flow releases from Los Padres Dam upstream. |
=== Summary === | === Summary === | ||
| Line 24: | Line 24: | ||
Based on visual comparison of flow duration curves, the Carmel River from Don Juan Bridge to Highway 1 appears to exhibit watershed processes such as: | Based on visual comparison of flow duration curves, the Carmel River from Don Juan Bridge to Highway 1 appears to exhibit watershed processes such as: | ||
| − | #Streambed infiltration | + | # Streambed infiltration |
| − | #Managed | + | # Managed streamflow sources |
== References == | == References == | ||
<references/> | <references/> | ||
| − | |||
| − | |||
| − | |||
== Links == | == Links == | ||
* [[Carmel River Watershed: Flow Duration Analyses]] | * [[Carmel River Watershed: Flow Duration Analyses]] | ||
Revision as of 08:42, 5 March 2009
The Y-axis on the graph below is incorrect, and the references in the text to specific flows are thus also incorrect.
Hydrologic setting
The Carmel River begins in the Santa Lucia Mountains and flows through Carmel Valley to the Pacific Ocean. The Don Juan Bridge gage lies in the Carmel valley and serves as a Carmel River midpoint. The Highway 1 Bridge gage lies at the mouth of the Carmel River, several miles downstream of the Don Juan gage. A wide floodplain with generally porous and permeable soils lies between these 2 points. This area in general is classified as a recharge area [1].
Analysis
The flow duration curve (FDC) for the Carmel River indicates that at Don Juan Bridge, the river flows at least 99.9% of the time and suggests that the river is perennial at this point. 50% of the time, the Carmel river flows 10 m3/s or greater. 20% of the time, the Carmel river flows 100 m3/s or greater. The general smoothness of the FDC may be indicative of an unregulated flow regime.
The FDC for the Carmel River at Highway 1 has a smooth curve with a steep drop off indicating unregulated and uncommon flows with flow roughly 50% of the time. This gage is located in the lower Carmel watershed and considering the wide floodplain path from Don Juan Bridge to Highway 1, the Carmel River may have significant loss to infiltration.
Comparing the two curves, the Don Juan Bridge flow and Highway 1 flow have nearly equal duration curves with periods of very high flow ( >100 m3/s). There is a significant separation between both curves in periods of low flow (<100 m3/s). There is also a slight separation during anomalously high flow periods ( >3000 m3/s ). These observations in combination indicate either:
- Low to medium flows at Don Juan are lost in the lower reaches (i.e. to infiltration and aquifer recharge)
- The lower watershed below San Juan only contributes a net increase to the flow during very high flows (<1% of the time)
The lower Carmel River goes dry annually due to heavy infiltration of surface waters to replace groundwater in the Carmel aquifer which is pumped for municipal use. The continuous flow of the Carmel River at the Don Juan Bridge may indicate a source of flow that is unrelated to direct storm runoff, such as baseflow from groundwater, or summer low-flow releases from Los Padres Dam upstream.
Summary
Based on visual comparison of flow duration curves, the Carmel River from Don Juan Bridge to Highway 1 appears to exhibit watershed processes such as:
- Streambed infiltration
- Managed streamflow sources
