Difference between revisions of "Carmel River Watershed: Map of Subwatersheds and Gage Locations"
From CCoWS Wiki
(Created page with "thumb *PDF file - for printing * PNG file == Metadata == * Original source of data...") |
|||
| Line 2: | Line 2: | ||
*[[Media:subwatersheds.pdf|PDF file - for printing]] | *[[Media:subwatersheds.pdf|PDF file - for printing]] | ||
* [[Media:subwatersheds.png|PNG file]] | * [[Media:subwatersheds.png|PNG file]] | ||
| + | |||
| + | == Subwatershed Data == | ||
| + | {| | ||
| + | |||
| + | |} | ||
== Metadata == | == Metadata == | ||
| − | * Original source of data: | + | * Original source of data: The National Map [https://viewer.nationalmap.gov/basic/] |
* Map produced by: Nikki Inglis | * Map produced by: Nikki Inglis | ||
| − | |||
| − | |||
* Geographic Coordinate System: GCS_North_American_1983 | * Geographic Coordinate System: GCS_North_American_1983 | ||
**Datum: D_North_American_1983 | **Datum: D_North_American_1983 | ||
| − | == Processing Steps == | + | == ArcGIS Processing Steps == |
| + | |||
| − | # | + | # Clipped the digital elevation model (DEM) into a TIFF comprising the study area (Clip tool) |
| − | # | + | # Eliminated ocean cells by selecting and extracting DEM values greater than 0 (Extract by attributes tool) |
| − | # | + | # Filled spurious sinks to account for small errors and imperfections in the DEM (Fill tool) Manually created a new line feature (levee) to correct a flow direction error. In our analysis, a tributary had failed to connect with the Carmel at its actual confluence above a flow gauge, instead connecting further downstream below the gauge site. (Create features) |
| + | # Merged the levee feature with the filled DEM .tif (Raster calculator tool)# Created a raster that determined flow direction based on each cell’s steepest downslope neighboring cell (Flow direction tool) | ||
| + | # Created a raster of accumulated flow in each cell based off the flow direction raster (Flow accumulation tool) | ||
| + | # Created stream vectors by calculating pixel count based on a 2 km, 10 km and 30 km area (Raster calculator) Snapped gauging sites to the implied streams (done manually) | ||
| + | # Determined watershed and subwatershed boundaries by calculating the contributing cells above each flow gauge using the flow direction raster (Watershed tool) | ||
| + | # Projected watershed boundaries to a Projected Coordinate System to calculate areas (Raster to polygon and Project tools, Calculate geometry in attribute table) | ||
== Links == | == Links == | ||
* [[Maps of the Carmel River Watershed]] | * [[Maps of the Carmel River Watershed]] | ||
Revision as of 13:51, 30 March 2017

Subwatershed Data
Metadata
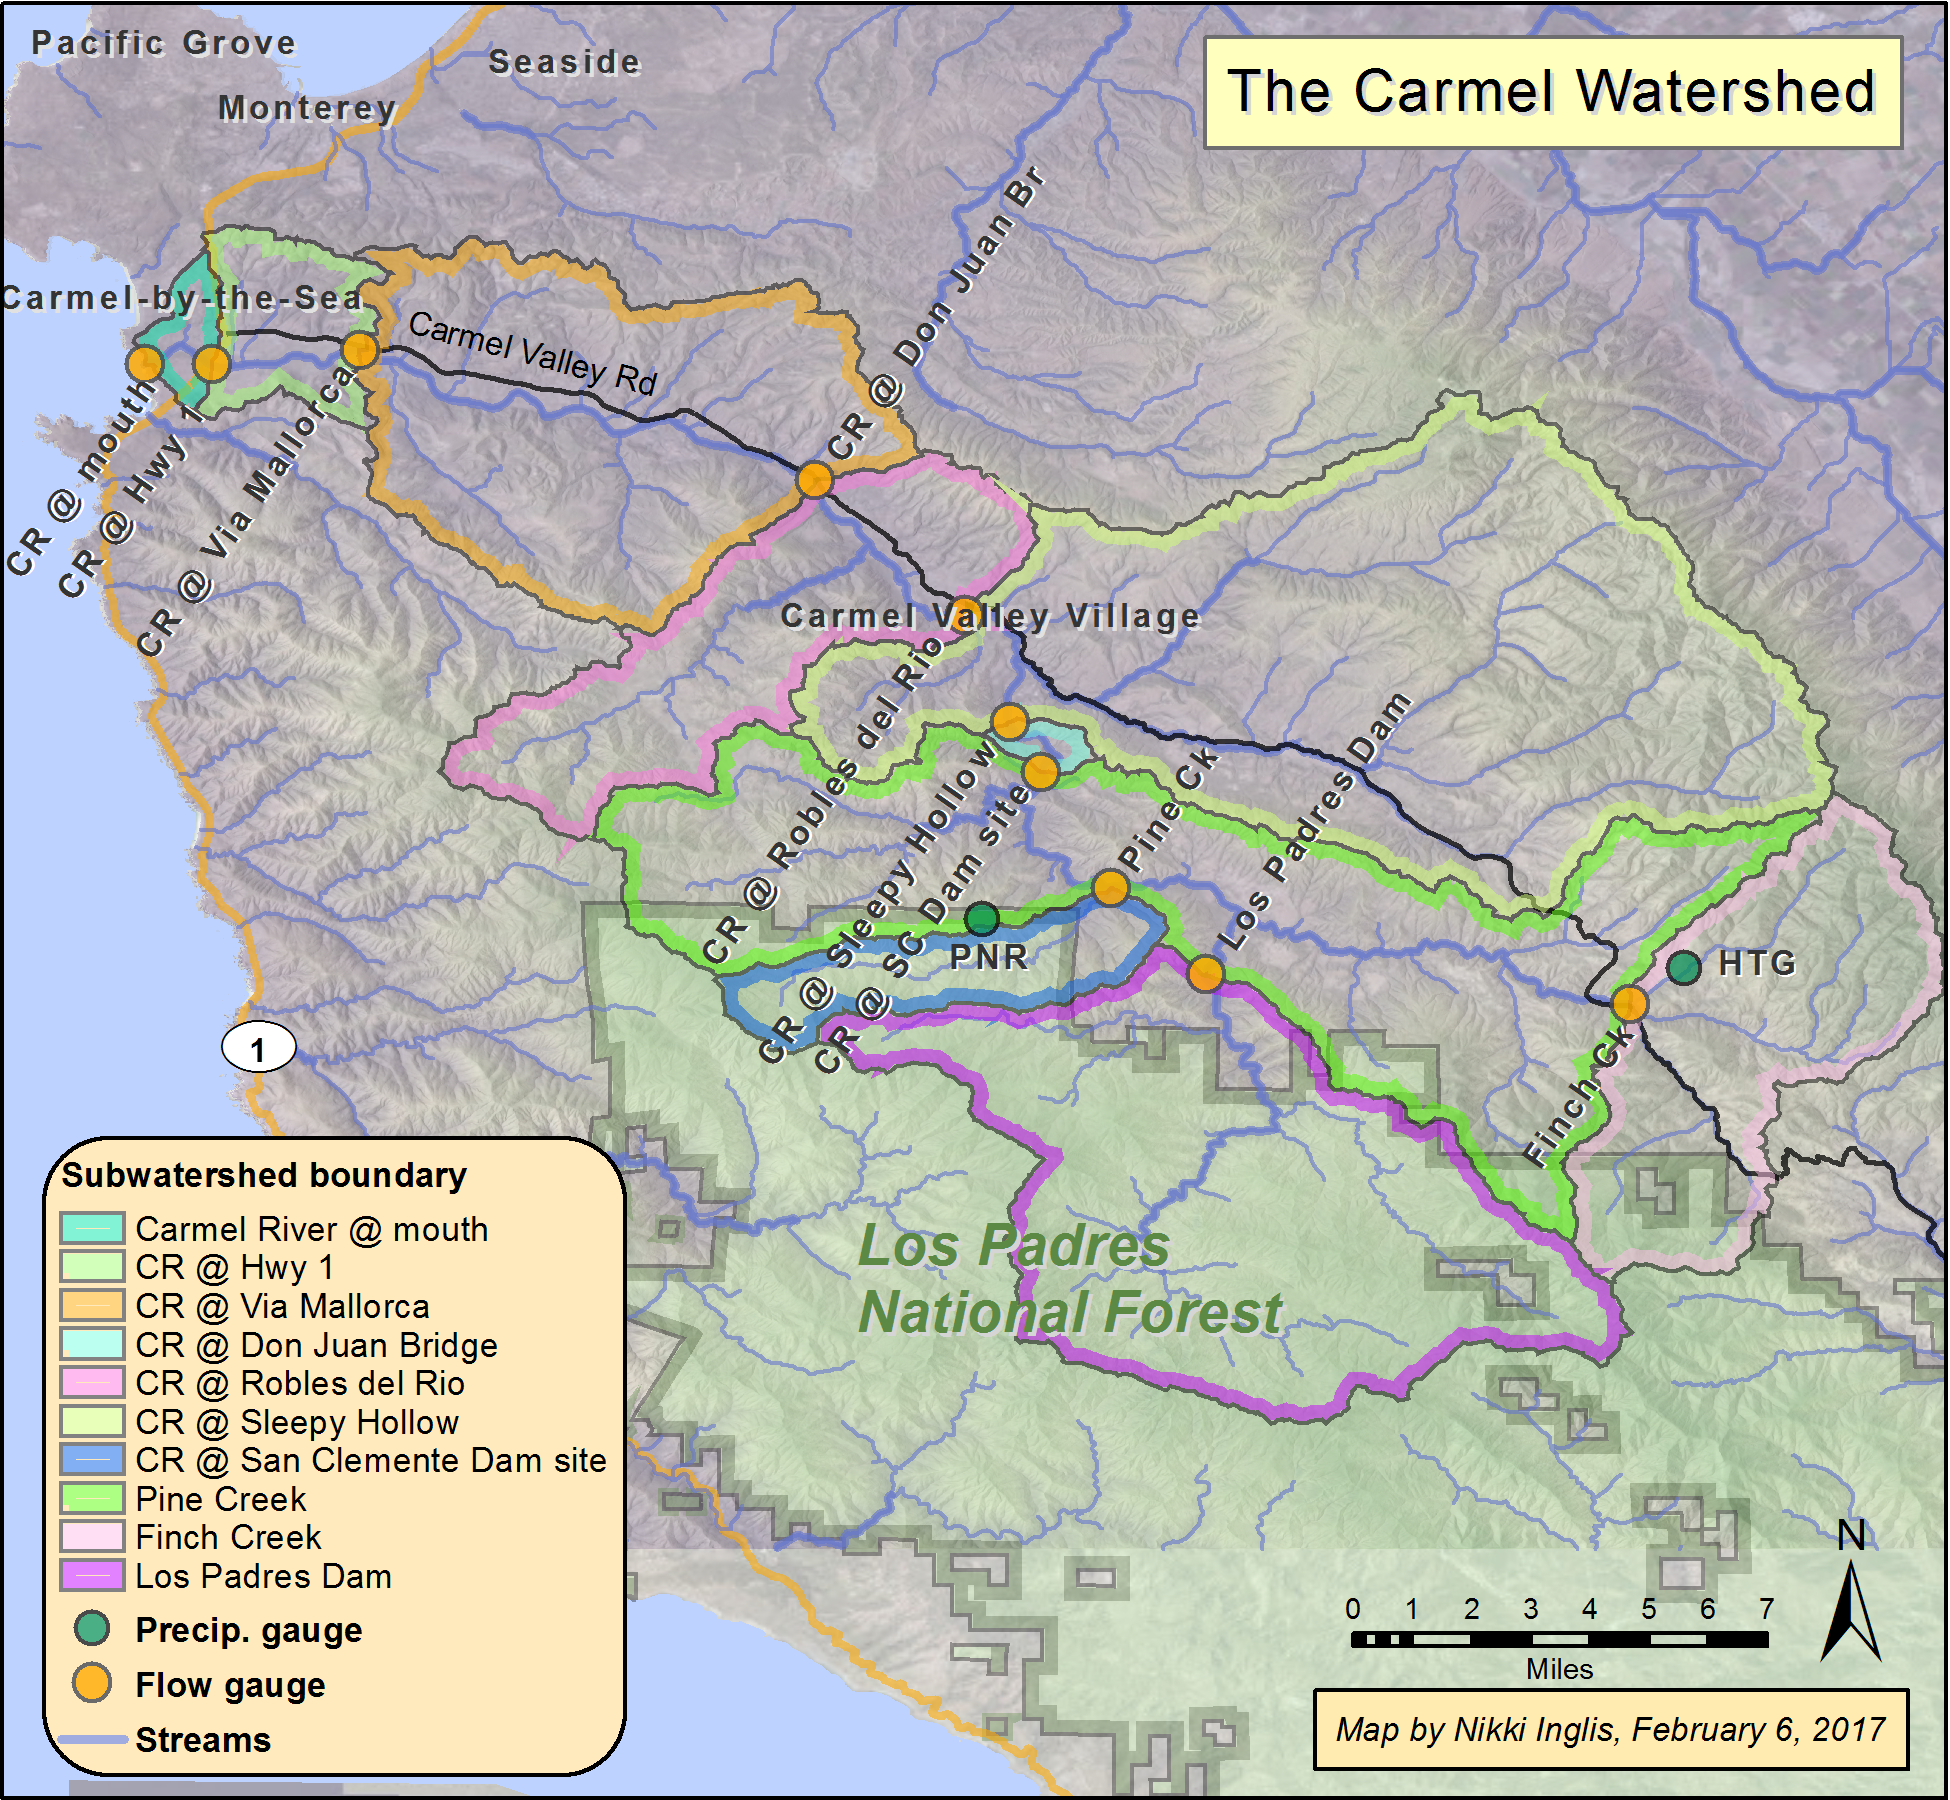
- Original source of data: The National Map [1]
- Map produced by: Nikki Inglis
- Geographic Coordinate System: GCS_North_American_1983
- Datum: D_North_American_1983
ArcGIS Processing Steps
- Clipped the digital elevation model (DEM) into a TIFF comprising the study area (Clip tool)
- Eliminated ocean cells by selecting and extracting DEM values greater than 0 (Extract by attributes tool)
- Filled spurious sinks to account for small errors and imperfections in the DEM (Fill tool) Manually created a new line feature (levee) to correct a flow direction error. In our analysis, a tributary had failed to connect with the Carmel at its actual confluence above a flow gauge, instead connecting further downstream below the gauge site. (Create features)
- Merged the levee feature with the filled DEM .tif (Raster calculator tool)# Created a raster that determined flow direction based on each cell’s steepest downslope neighboring cell (Flow direction tool)
- Created a raster of accumulated flow in each cell based off the flow direction raster (Flow accumulation tool)
- Created stream vectors by calculating pixel count based on a 2 km, 10 km and 30 km area (Raster calculator) Snapped gauging sites to the implied streams (done manually)
- Determined watershed and subwatershed boundaries by calculating the contributing cells above each flow gauge using the flow direction raster (Watershed tool)
- Projected watershed boundaries to a Projected Coordinate System to calculate areas (Raster to polygon and Project tools, Calculate geometry in attribute table)