File list
From CCoWS Wiki
This special page shows all uploaded files.
| Name | Thumbnail | Size | User | Description | Versions | |
|---|---|---|---|---|---|---|
| 20:00, 28 March 2012 | 2009 region3 map.png (file) |  |
97 KB | Gwenm | 1 | |
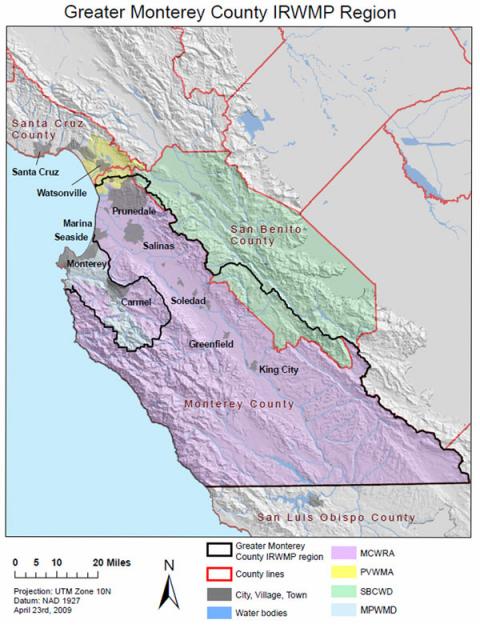
| 21:47, 28 March 2012 | Region map.jpg (file) |  |
54 KB | Shanek | alt text Integrated Regional Water Management Plan (IRWMP) for the Greater Monterey County. Provided by the Central Coast Wetlands Group<ref>http://www.google.com/imgres?um=1&hl=en&safe=off&client=firefox-a&sa=N&rls=org | 2 |
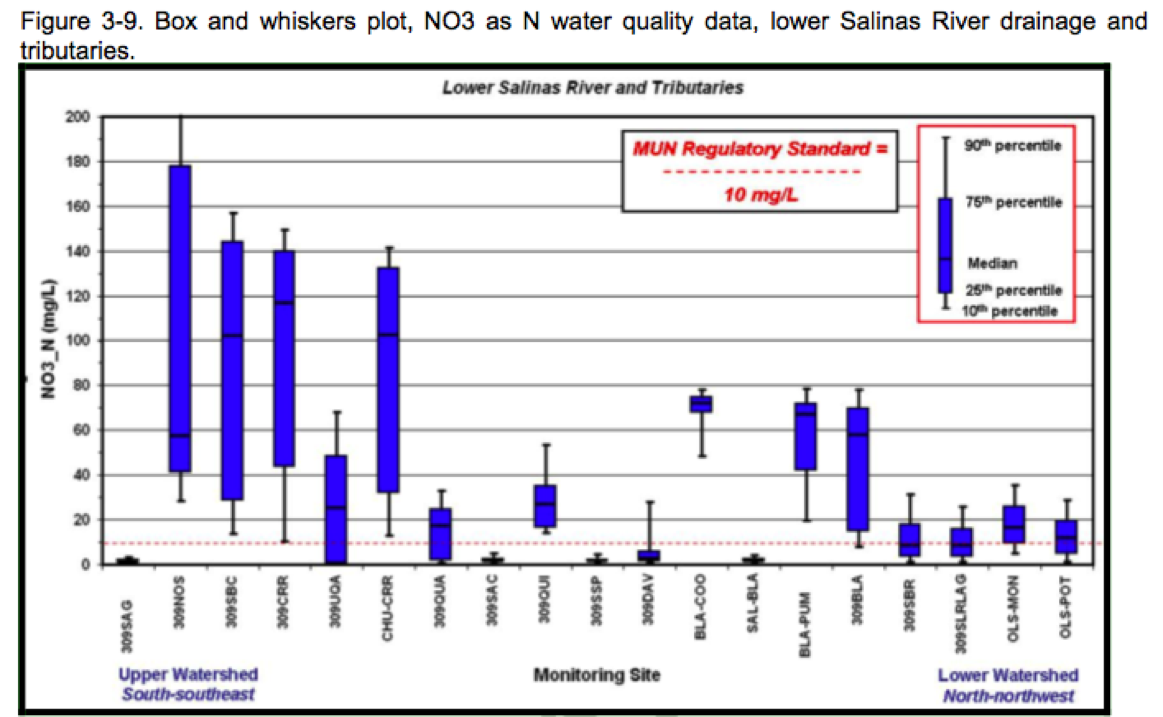
| 00:44, 29 March 2012 | NitrateBoxPlot TMDL2012.png (file) |  |
290 KB | Scottb | Boxplot of median nitrate concentrations in areas sampled for the TMDL Draft Report from CCWQRCB (2012). Public agency, therefore public domain | 1 |
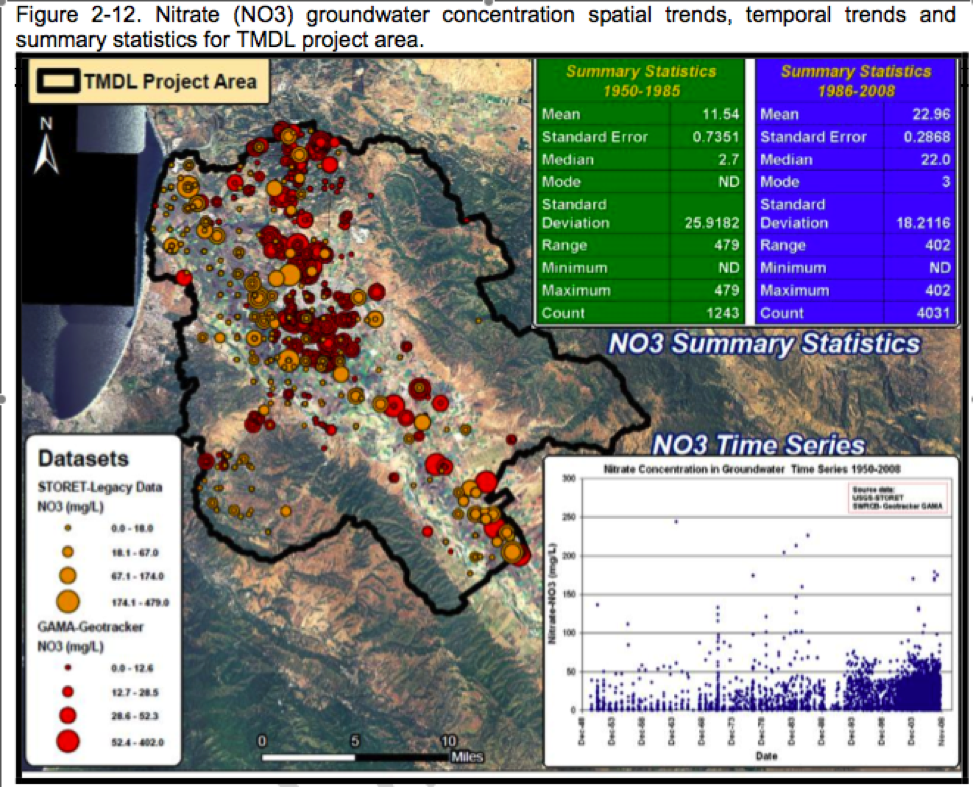
| 00:46, 29 March 2012 | Nitrate Map 2012TMDLDraftReport.png (file) |  |
1.02 MB | Scottb | Nitrate map TMDL draft report CCWQRCB (2012). Public agency, public domain image | 1 |
| 00:48, 29 March 2012 | MS4Outfalls TMDL2012.png (file) |  |
459 KB | Scottb | Photographic documentation of MS4 (combined sewer stormwater) outfalls in Salinas, CA. From the CCWQRCB 2012 preliminary draft report on TMDLs for the Lower Salinas Valley Watershed. Public agency, no copyright | 1 |
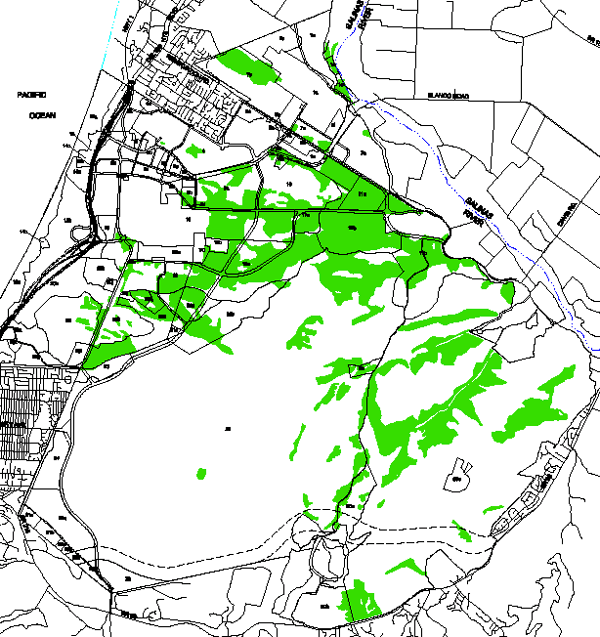
| 00:50, 29 March 2012 | Subwatersheds TMDL Nuts 2012.png (file) |  |
1.66 MB | Scottb | Subwatersheds identified in the preliminary draft report on TMDLs from the CCWQRCB (2012). Public agency=public domain | 1 |
| 00:52, 29 March 2012 | Subwatersheds TMDL Nuts 2012.jpeg (file) |  |
1.66 MB | Scottb | 1 | |
| 01:07, 29 March 2012 | NitrateMeas andSources.png (file) |  |
952 KB | Scottb | Map of nitrate measurements and possible sources. From the 2012 draft TMDL report from CCRWQCB. | 1 |
| 01:23, 29 March 2012 | Biostim 2 TMDL2012.png (file) |  |
412 KB | Scottb | Photographic documentation of biostimulation by nutrient loading in various waterways of the Lower Salinas Valley Watershed. From CCWQRCB 2012 draft TMDL nutrient report | 1 |
| 01:31, 29 March 2012 | TMDL Impairment Map.png (file) |  |
574 KB | Scottb | TMDL nutrient impairment map for the Lower Salinas Valley Watershed. From CCWQRCB 2012 draft TMDL nutrient report) | 1 |
| 02:03, 29 March 2012 | Majordrain TMDL projarea.png (file) |  |
729 KB | Scottb | main drainages of the proposed nutrient TMDL. from draft report (2012) CCRWQCB. | 1 |
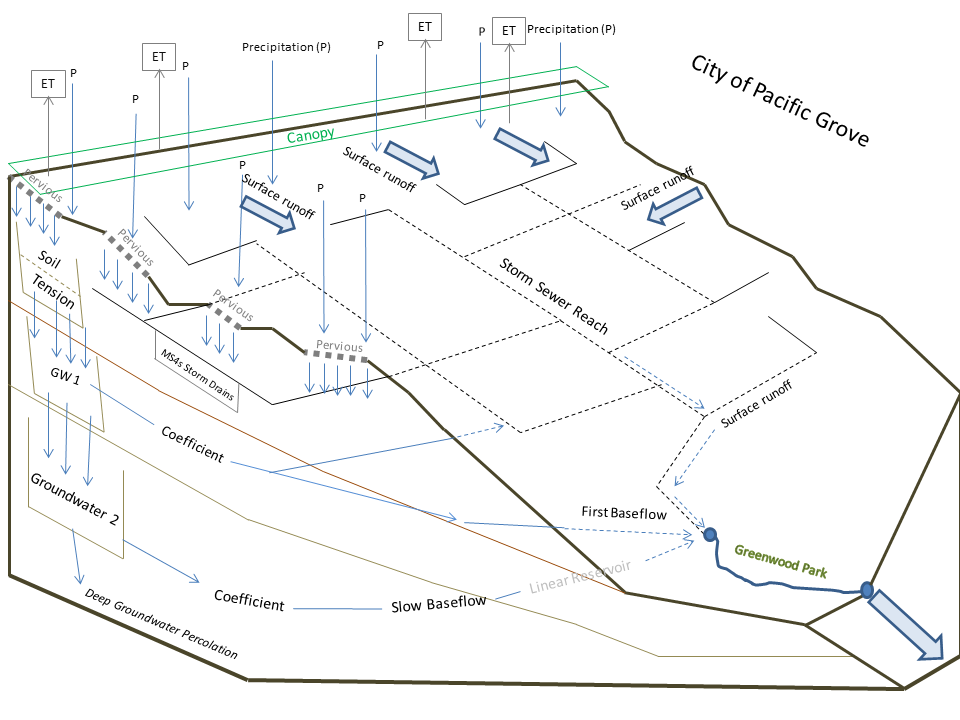
| 02:20, 29 March 2012 | PG PNG.png (file) | Error creating thumbnail: Invalid thumbnail parameters |
4.14 MB | Kirkp | The City of Pacific Grove is located on the NW portion of the Monterey Peninsula. The city contains multiple watershed including the Greenwood Park Watershed which is highly urbanized producing large volumes of stormflow runoff which is discharged into th | 1 |
| 02:26, 29 March 2012 | Final Imp Map.pdf (file) | 4.93 MB | Kirkp | The City of Pacific Grove is located on the NW portion of the Monterey Peninsula. The city contains multiple watershed including the Greenwood Park Watershed which is highly urbanized producing large volumes of stormflow runoff which is discharged into th | 1 | |
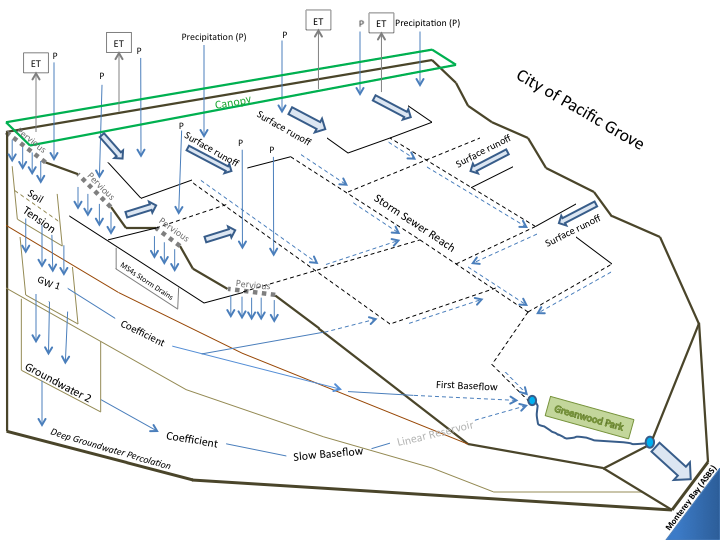
| 02:41, 29 March 2012 | GWP D final.png (file) |  |
88 KB | Kirkp | The City of Pacific Grove is located on the NW portion of the Monterey Peninsula. The city contains multiple watershed including the Greenwood Park Watershed which is highly urbanized producing large volumes of stormflow runoff which is discharged into th | 1 |
| 08:41, 29 March 2012 | Greenwoodpng.png (file) | Error creating thumbnail: Invalid thumbnail parameters |
1.75 MB | Kirkp | City of Pacific Grove and Greenwood Park impervious cover. Map: by Kirk Post | 1 |
| 08:47, 29 March 2012 | Greenwood.png (file) | Error creating thumbnail: Invalid thumbnail parameters |
1.75 MB | Kirkp | Greenwood park map, created by Kirk Post | 1 |
| 08:56, 29 March 2012 | Greenwood1.png (file) |  |
488 KB | Kirkp | City of Pacific Grove impervious cover, highlighting the Greenwood Park Watershed. Map by: Kirk Post | 2 |
| 13:17, 29 March 2012 | TMDL2.jpg (file) |  |
230 KB | Cheriec | 1 | |
| 13:20, 29 March 2012 | TMDL.jpg (file) |  |
232 KB | Cheriec | 2 | |
| 12:28, 31 March 2012 | CEMAR Salinas Watershed.pdf (file) | 1.45 MB | Shelleyp | 1 | ||
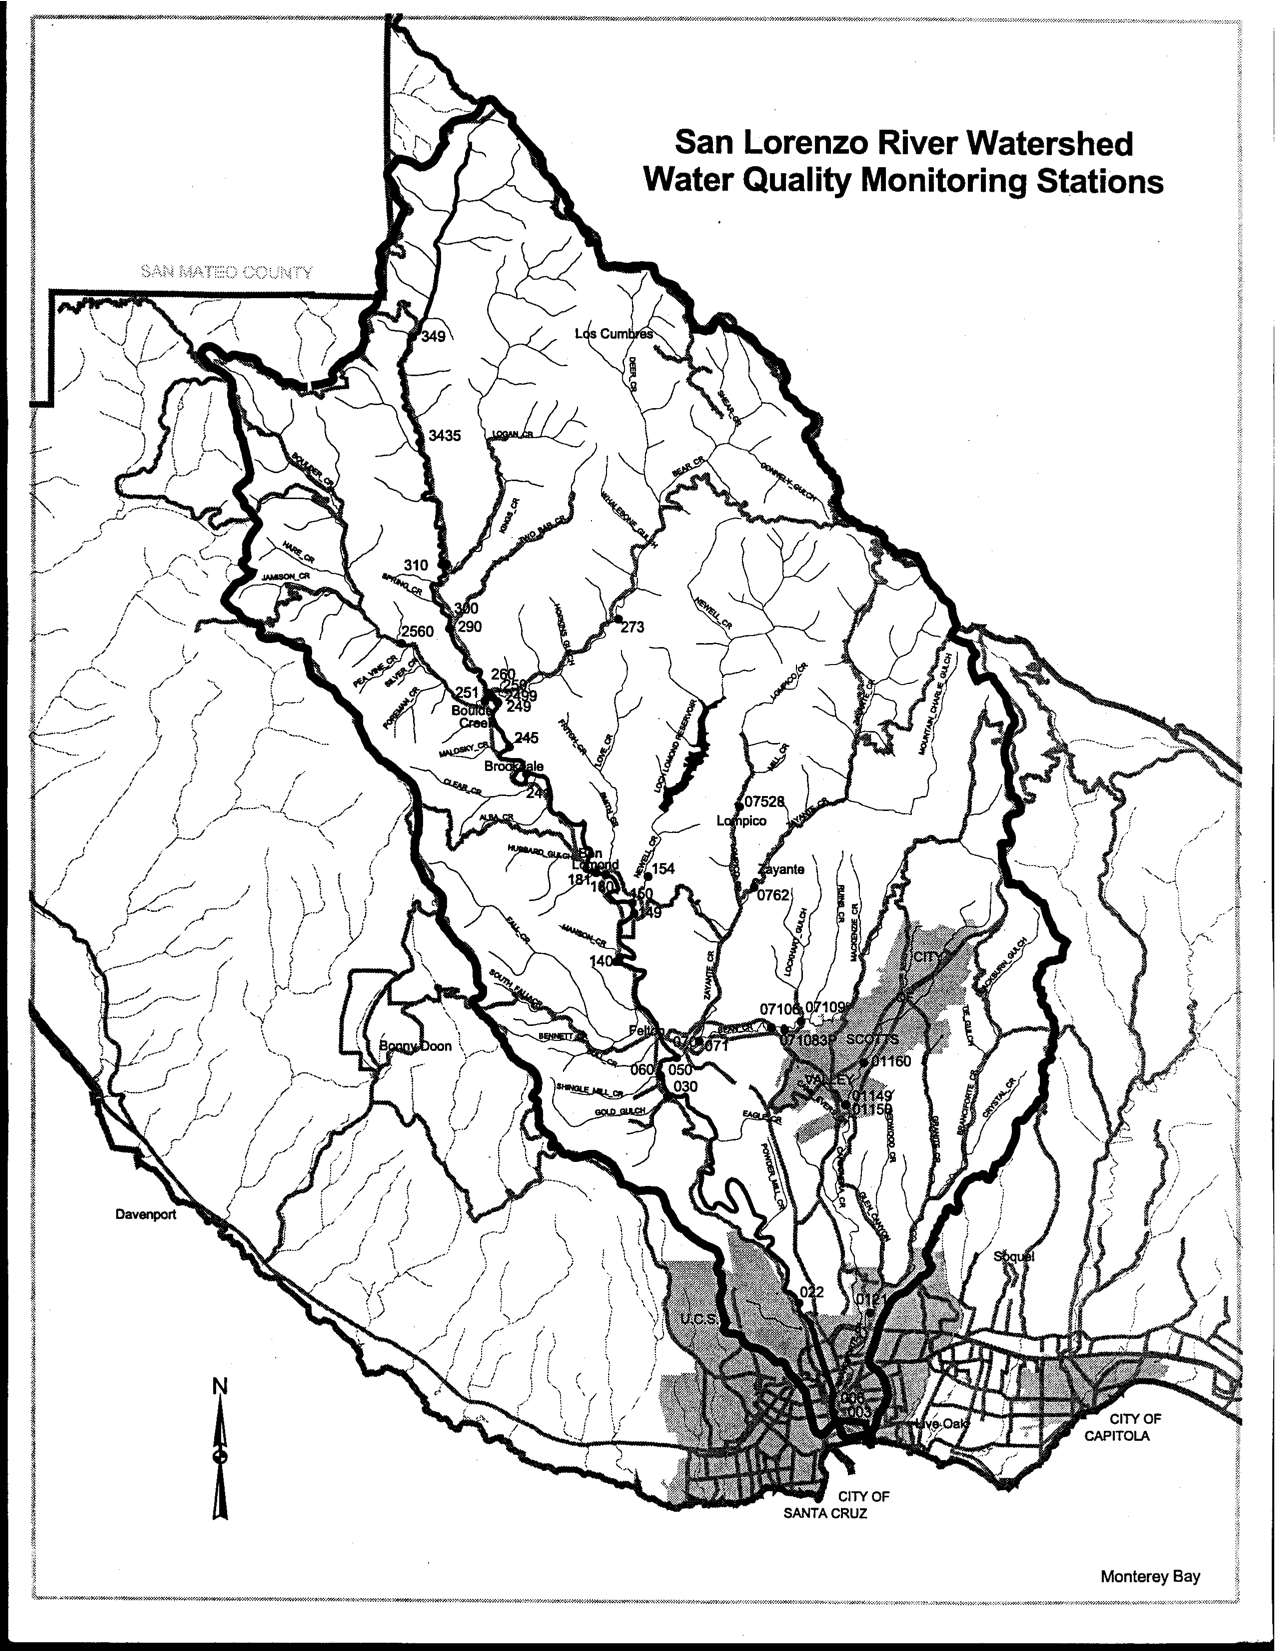
| 16:14, 31 March 2012 | San lorenzo river watershed water quality monitoring stations.png (file) |  |
696 KB | Pollyp | [http://sccounty01.co.santa-cruz.ca.us/eh/environmental_water_quality/pdfs/san_lorenzo_river_watershed_water_quality_monitoring_stations.pdf Map] of San Lorenzo water quality stations . | 2 |
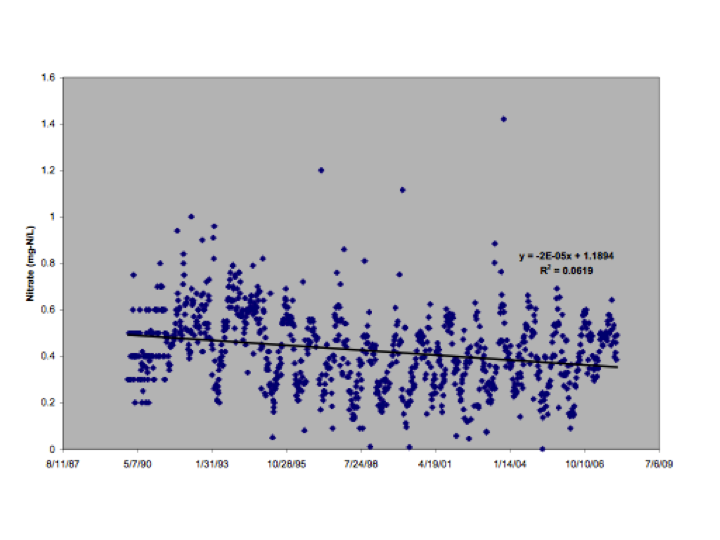
| 16:38, 31 March 2012 | San Lorenzo Nitrate trend 1990-2007.png (file) |  |
125 KB | Pollyp | Graph of nitrate trend for San Lorenzo from [http://www.google.com/url?sa=t&rct=j&q=&esrc=s&source=web&cd=2&ved=0CDkQFjAB&url=http%3A%2F%2Fsccounty01.co.santa-cruz.ca.us%2Feh%2Fenvironmental_water_quality%2FWastewater_status_2006_2.pdf&ei=GpV3T9uDFuKViAKN | 1 |
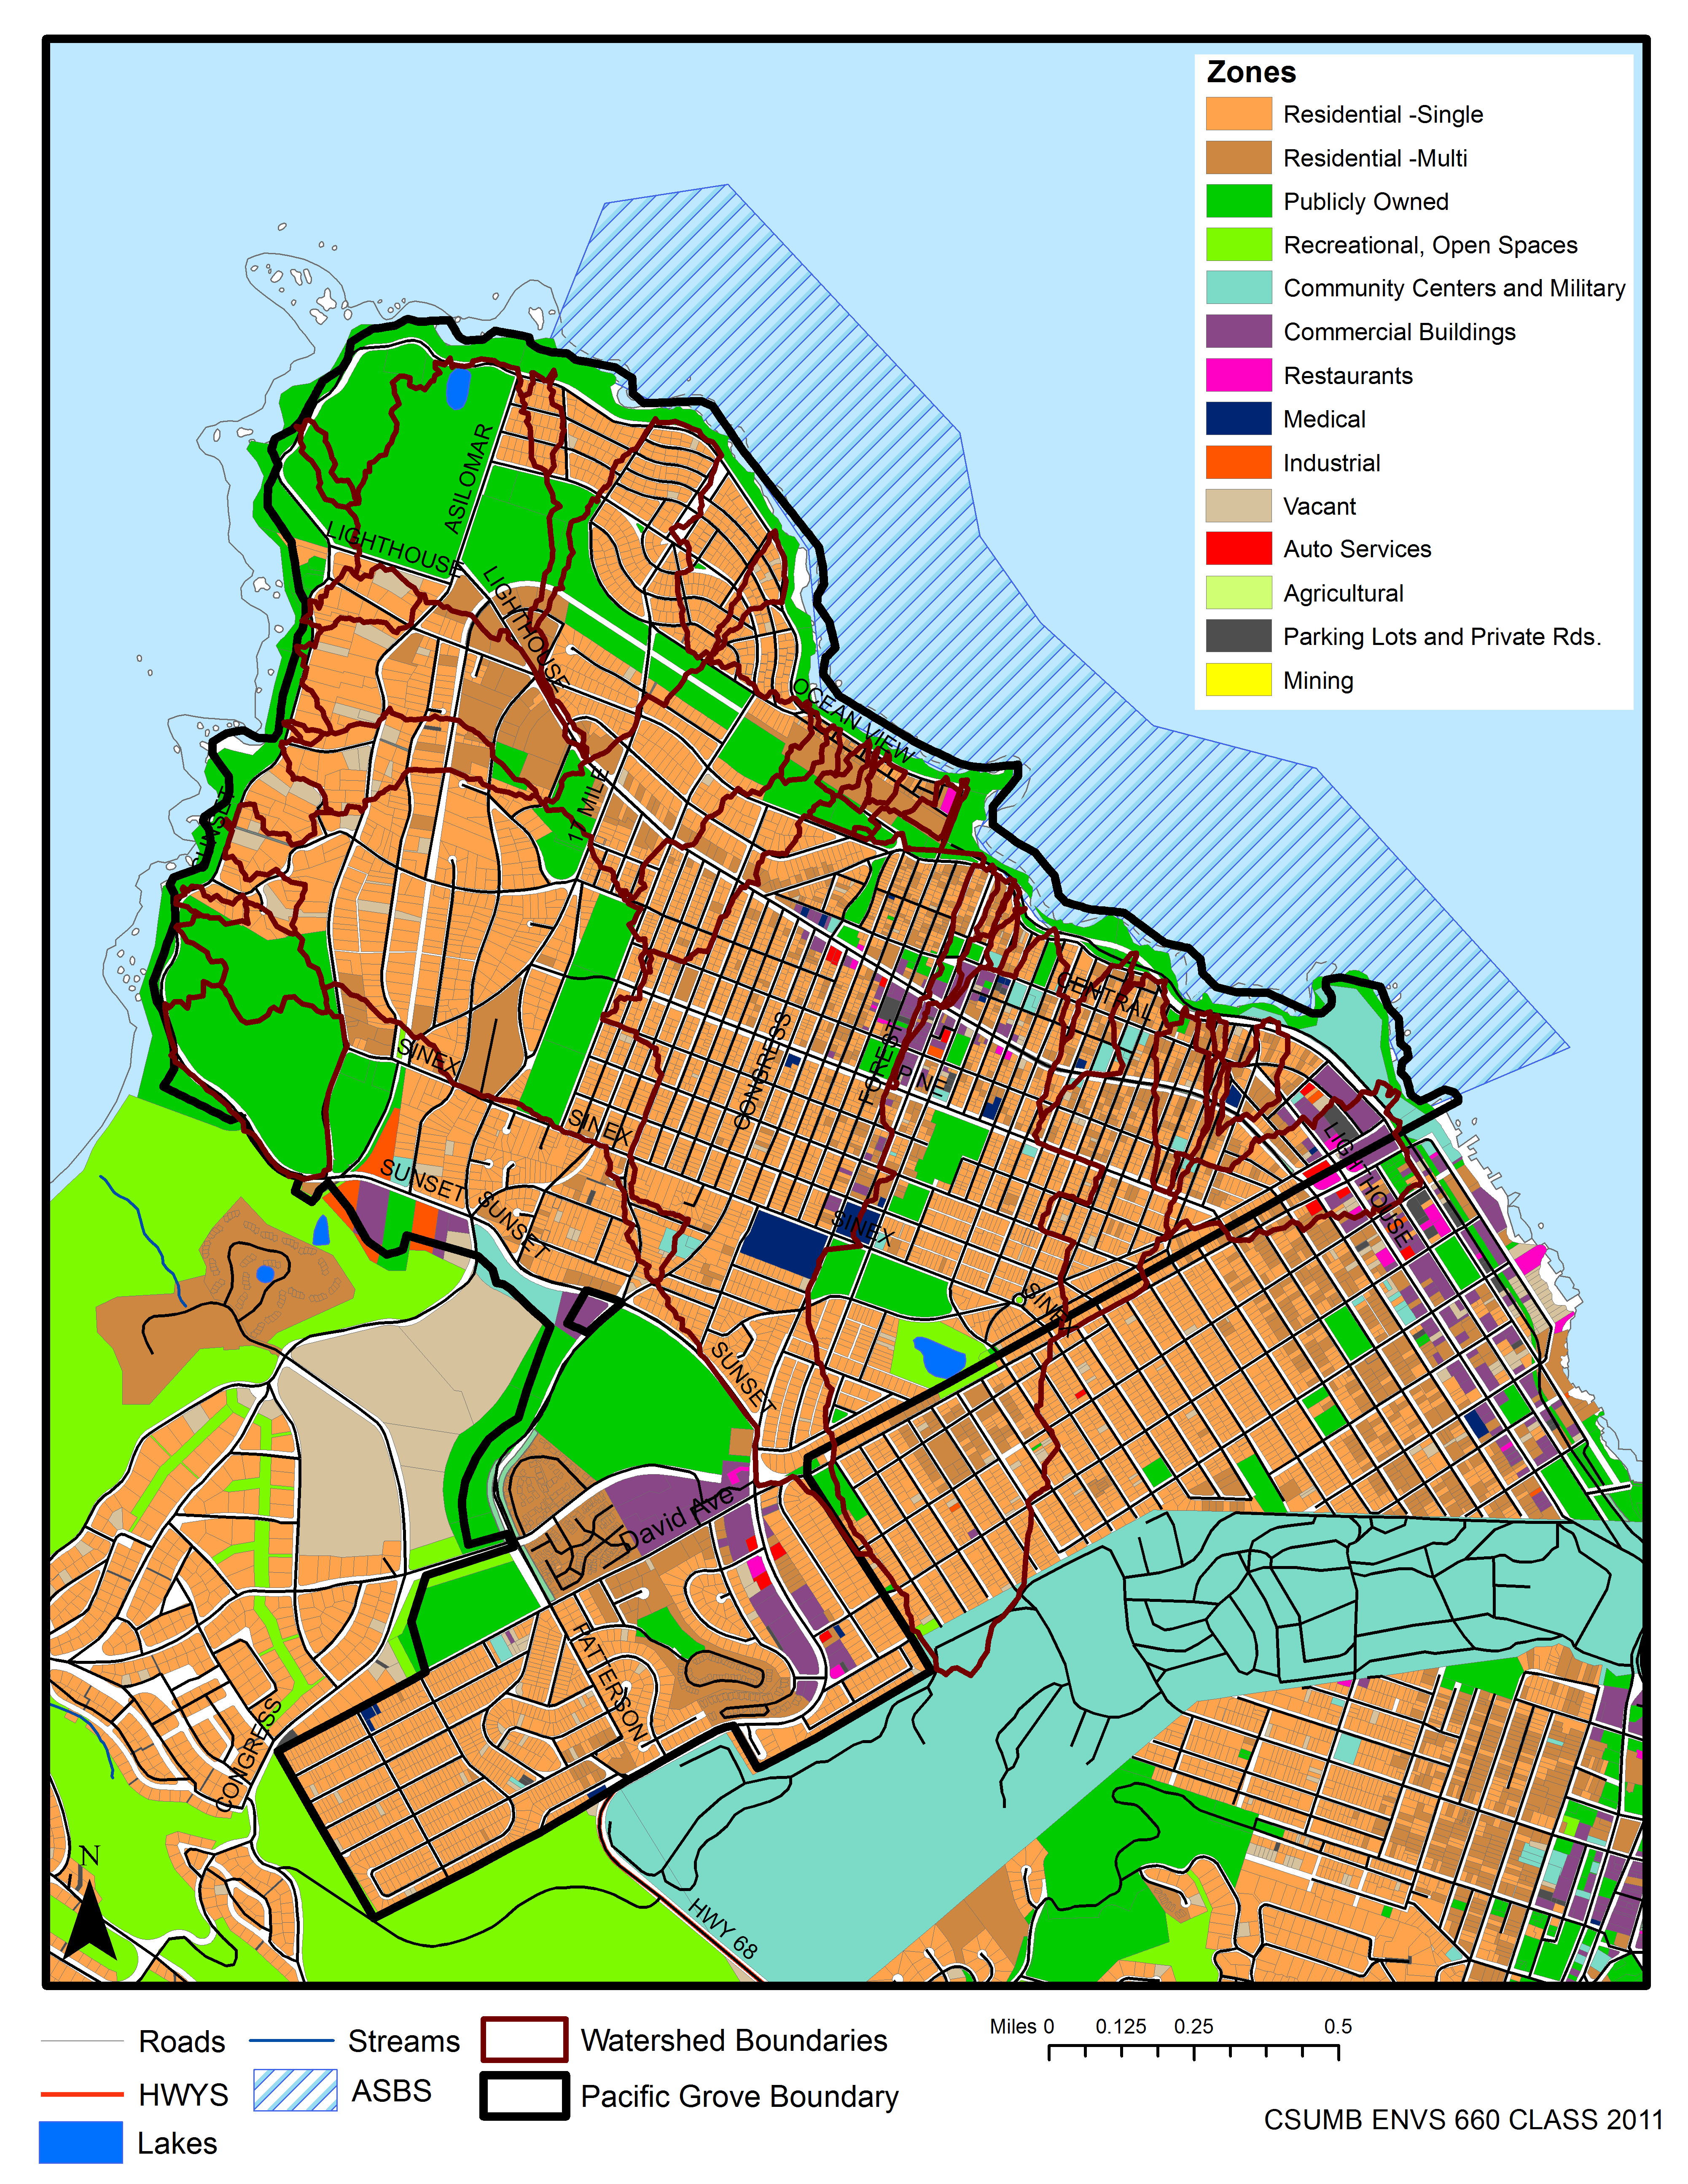
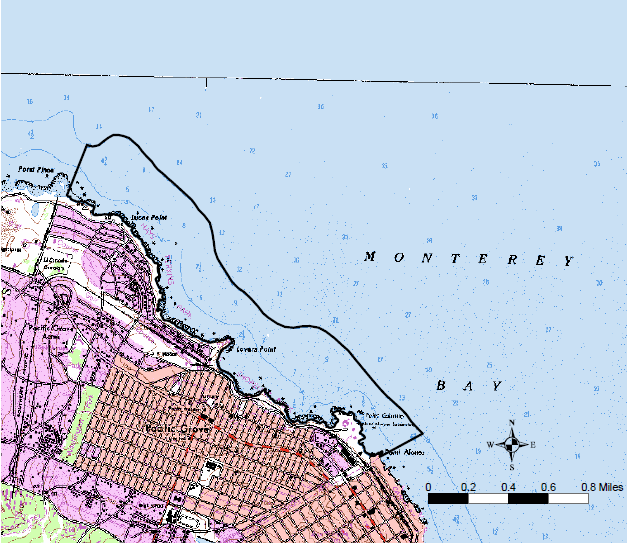
| 11:51, 1 April 2012 | PacificGrove LandUse.png (file) | Error creating thumbnail: Invalid thumbnail parameters |
1.41 MB | Kirkp | City of Pacific Grove boundary and landuse type. | 1 |
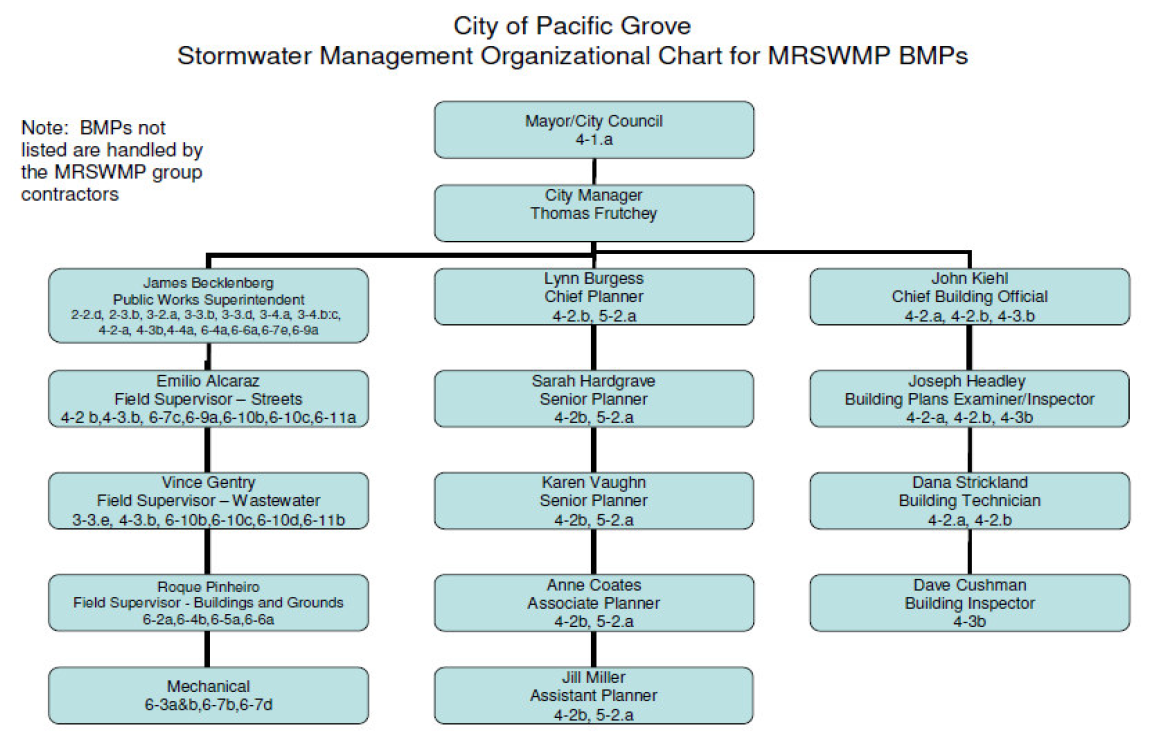
| 13:40, 1 April 2012 | City PG chart.PNG (file) |  |
567 KB | Kirkp | City of PG BMPs flow chart | 1 |
| 13:56, 4 April 2012 | TMDL development.jpeg (file) |  |
57 KB | Scottb | TMDL development chart figure 1-2 from [http://www.epa.gov/owow/tmdl/nutrient/pdf/nutrient.pdf] | 1 |
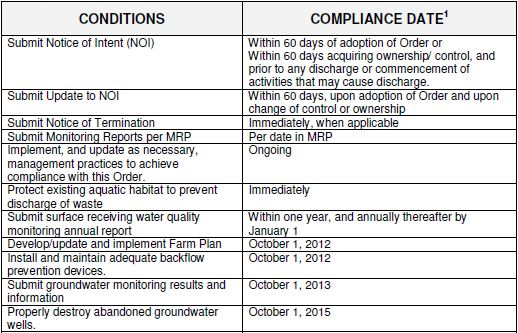
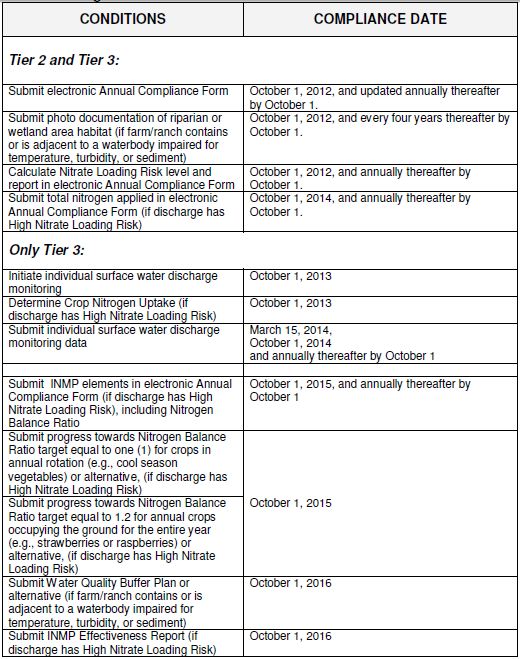
| 09:09, 5 April 2012 | AgWaiverReqs1.JPG (file) |  |
64 KB | Christinad | Table 1. Time schedule for compliance for all dischargers (Tier 1,2,&3). Taken from the final 2012 Conditional Waiver of Waste Requirements for Discharges from Irrigated Lands (Order No. R3-2012-0011). | 1 |
| 09:25, 5 April 2012 | AgWaiverReqs2.JPG (file) |  |
105 KB | Christinad | 1 | |
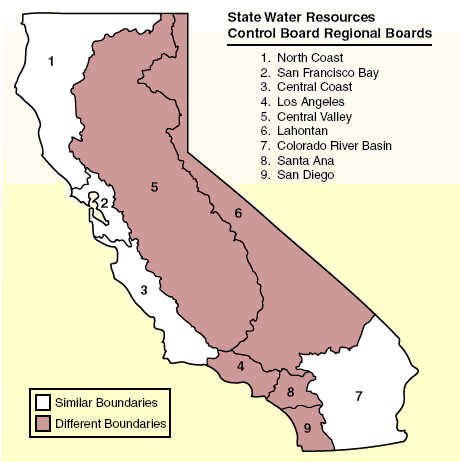
| 18:34, 5 April 2012 | Ca regions.jpg (file) |  |
122 KB | Brittanib | 1 | |
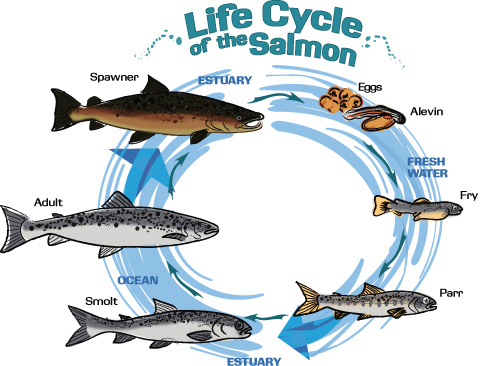
| 14:14, 10 April 2012 | 2salmonhistory.jpeg (file) |  |
119 KB | Gwenm | 1 | |
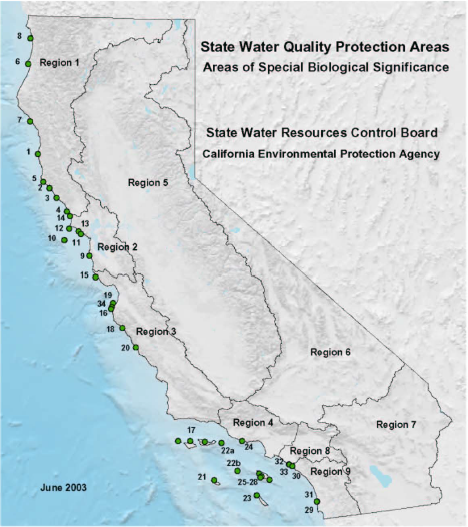
| 06:34, 12 April 2012 | ASBS.png (file) |  |
327 KB | Cheriec | 1 | |
| 08:18, 12 April 2012 | City PG chart.png (file) |  |
567 KB | Kirkp | 1 | |
| 10:59, 12 April 2012 | Stormwater.jpeg (file) |  |
291 KB | Cheriec | 1 | |
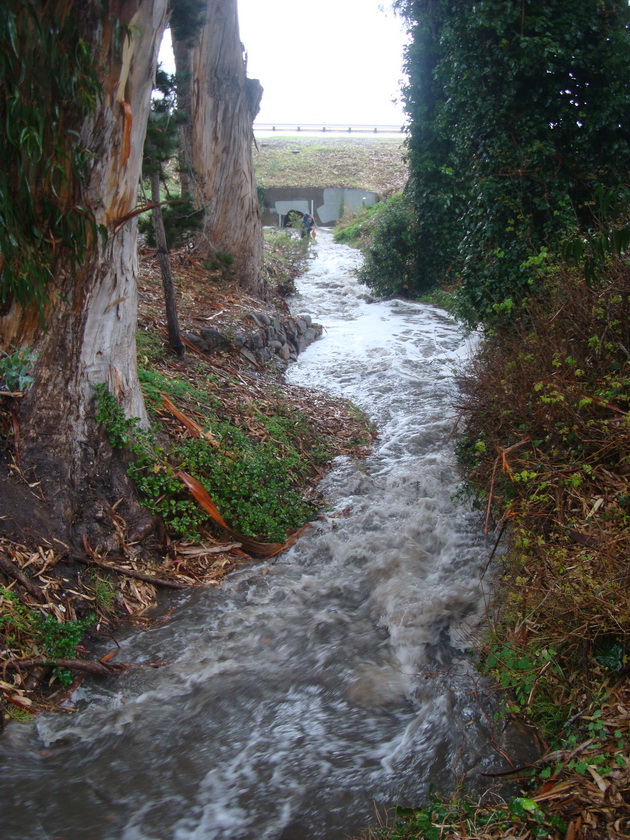
| 12:51, 12 April 2012 | Greenwood Park Diagram.png (file) |  |
151 KB | Kirkp | 2 | |
| 13:35, 12 April 2012 | Asbs19.png (file) |  |
91 KB | Cheriec | 1 | |
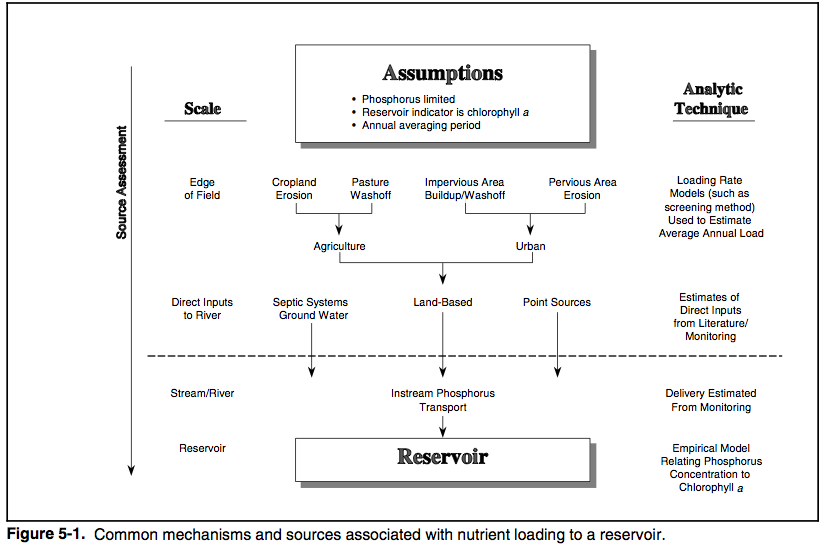
| 20:55, 21 April 2012 | TMDL source assessment.png (file) |  |
77 KB | Scottb | TMDL source assessment, from protocol document for developing nutrient TMDL standards | 1 |
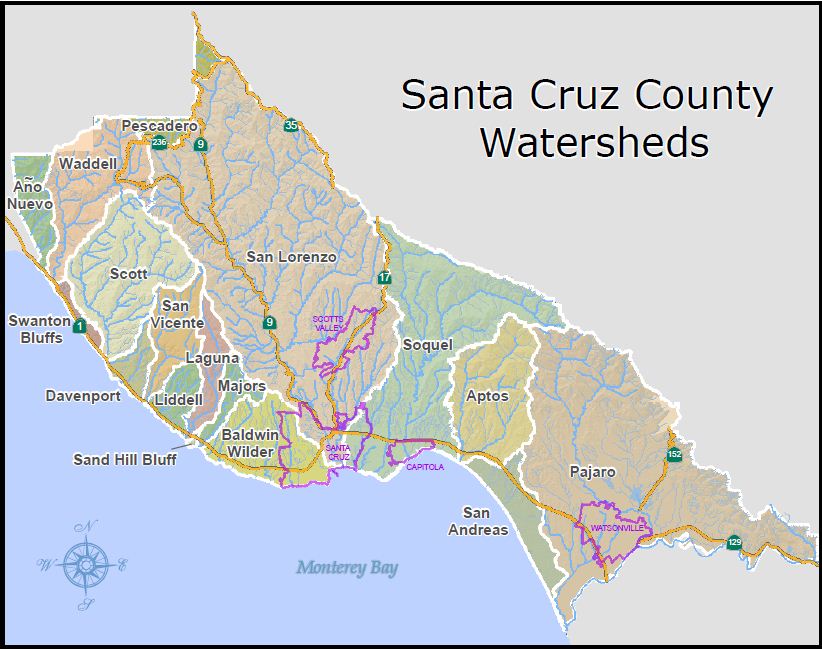
| 16:25, 26 March 2013 | SCwatersheds.JPG (file) |  |
98 KB | Ambers | Incorporated cities are highlighted in purple. Available from the County of Santa Cruz website: http://scceh.com/LinkClick.aspx?fileticket=_TC5i13SYwA%3d&tabid=1768 | 1 |
| 16:30, 26 March 2013 | SCwatersheds.jpg (file) |  |
98 KB | Ambers | Incorporated cities are highlighted in purple. Available from the County of Santa Cruz website: http://scceh.com/LinkClick.aspx?fileticket=_TC5i13SYwA%3d&tabid=1768 | 1 |
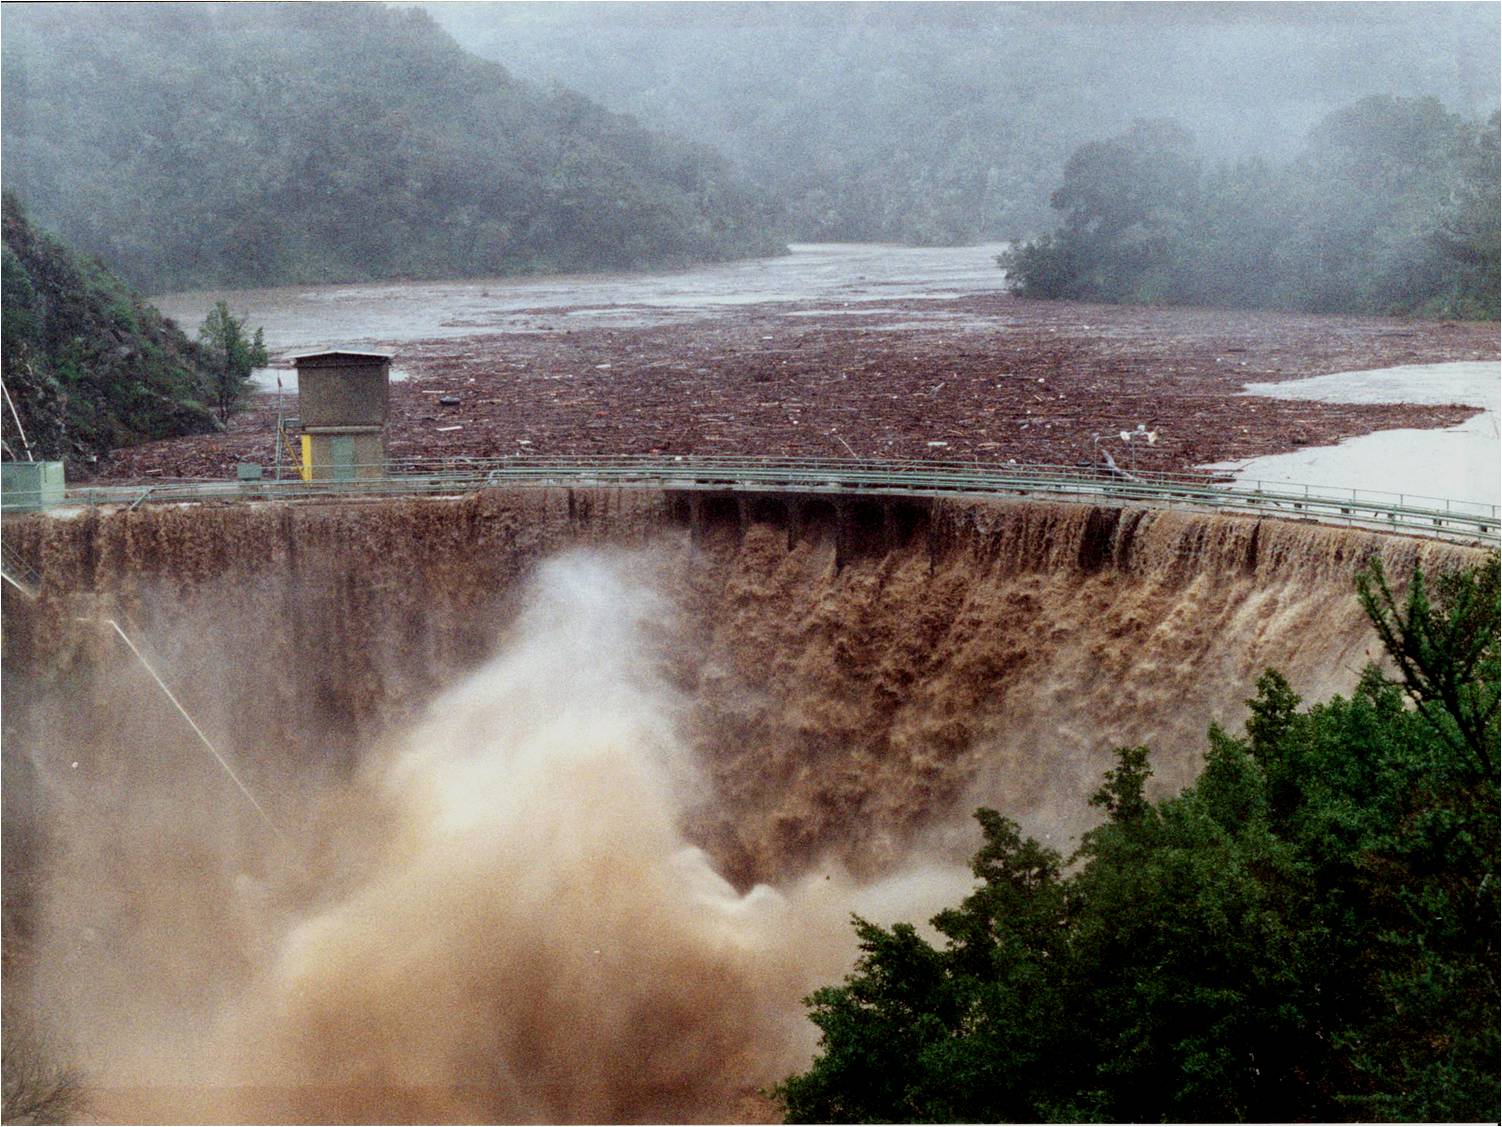
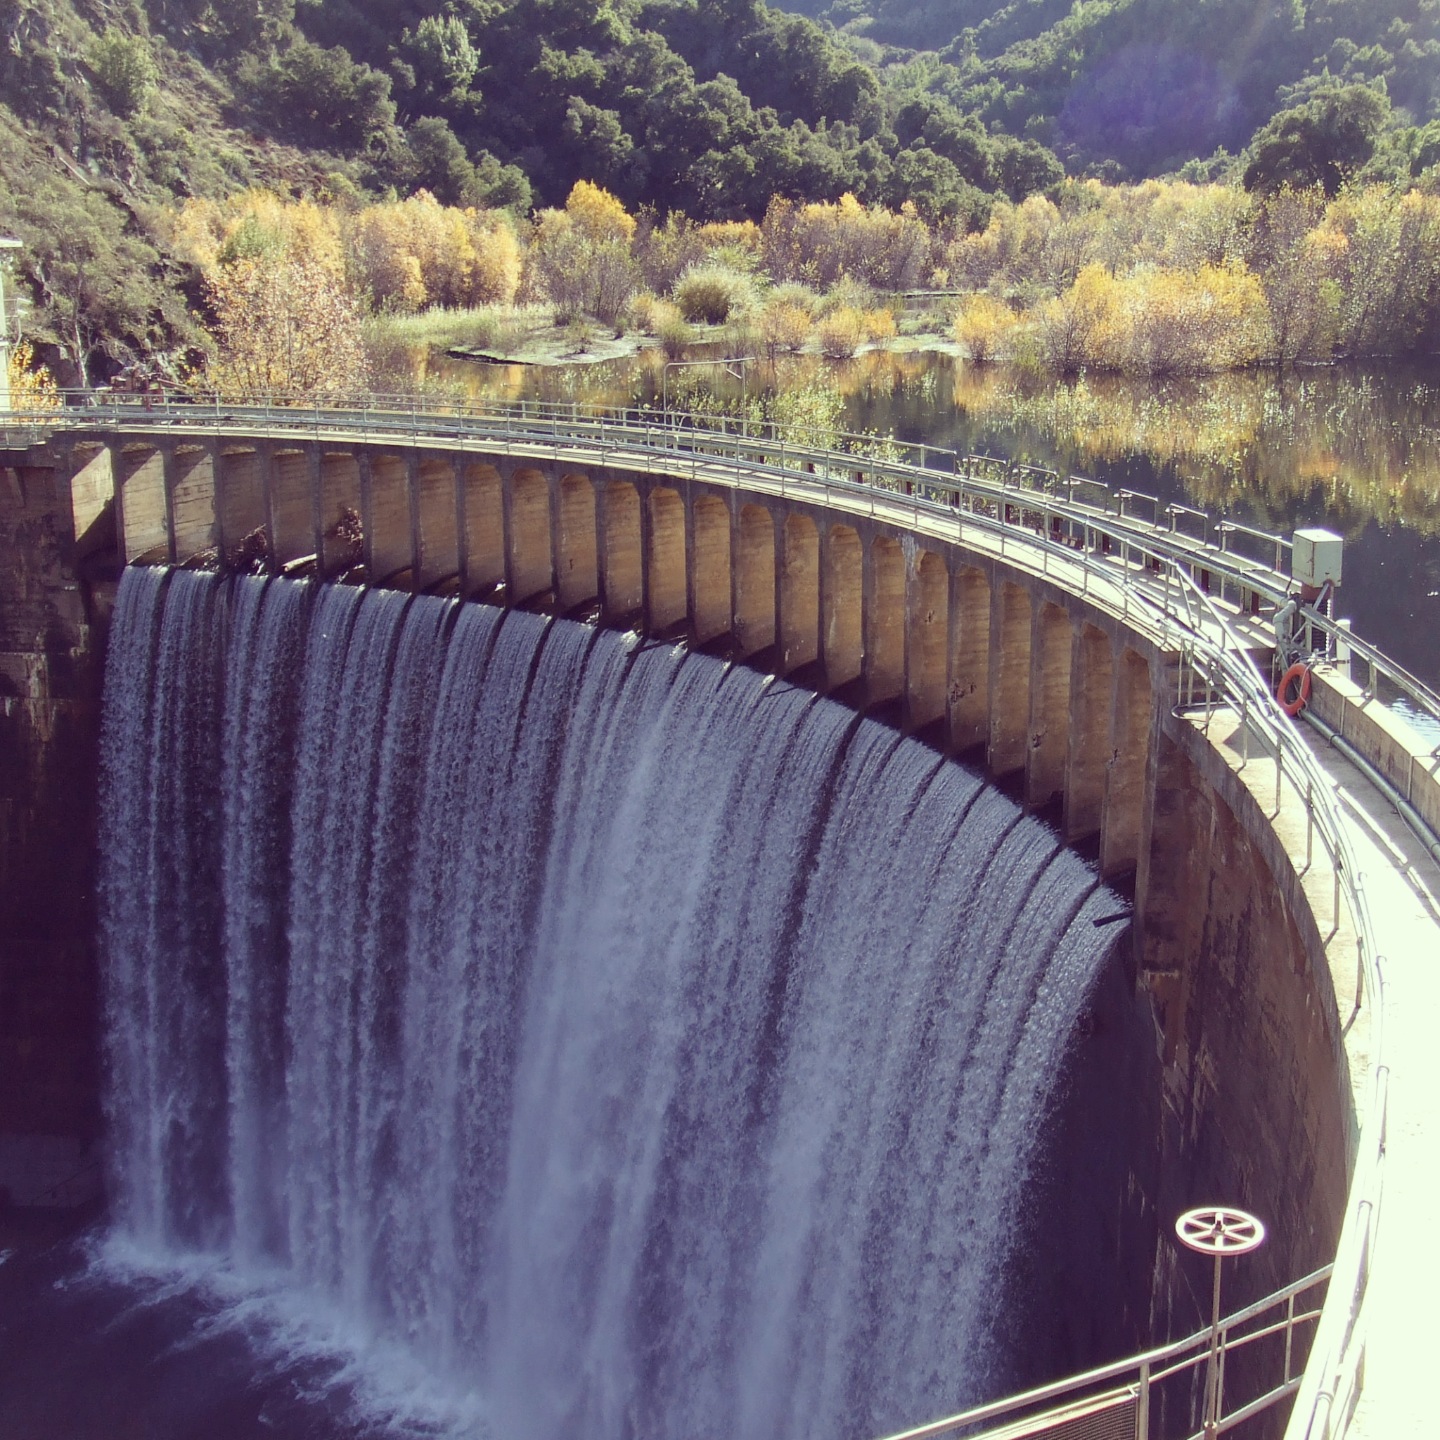
| 23:48, 27 March 2013 | Sanclementedam 2 NOAA.jpg (file) |  |
266 KB | Johnu | San Clemente Dam being overtopped by highly sedimented water during rain storm. Image: NOAA | 1 |
| 11:55, 28 March 2013 | Drmp.pdf (file) | 859 KB | Aimeet | 1 | ||
| 12:04, 28 March 2013 | FORA Base Reuse Plan Vol 1.pdf (file) | 5.11 MB | Aimeet | 1 | ||
| 12:07, 28 March 2013 | FORA Base Reuse Plan Vol 2.pdf (file) | 7.37 MB | Aimeet | 1 | ||
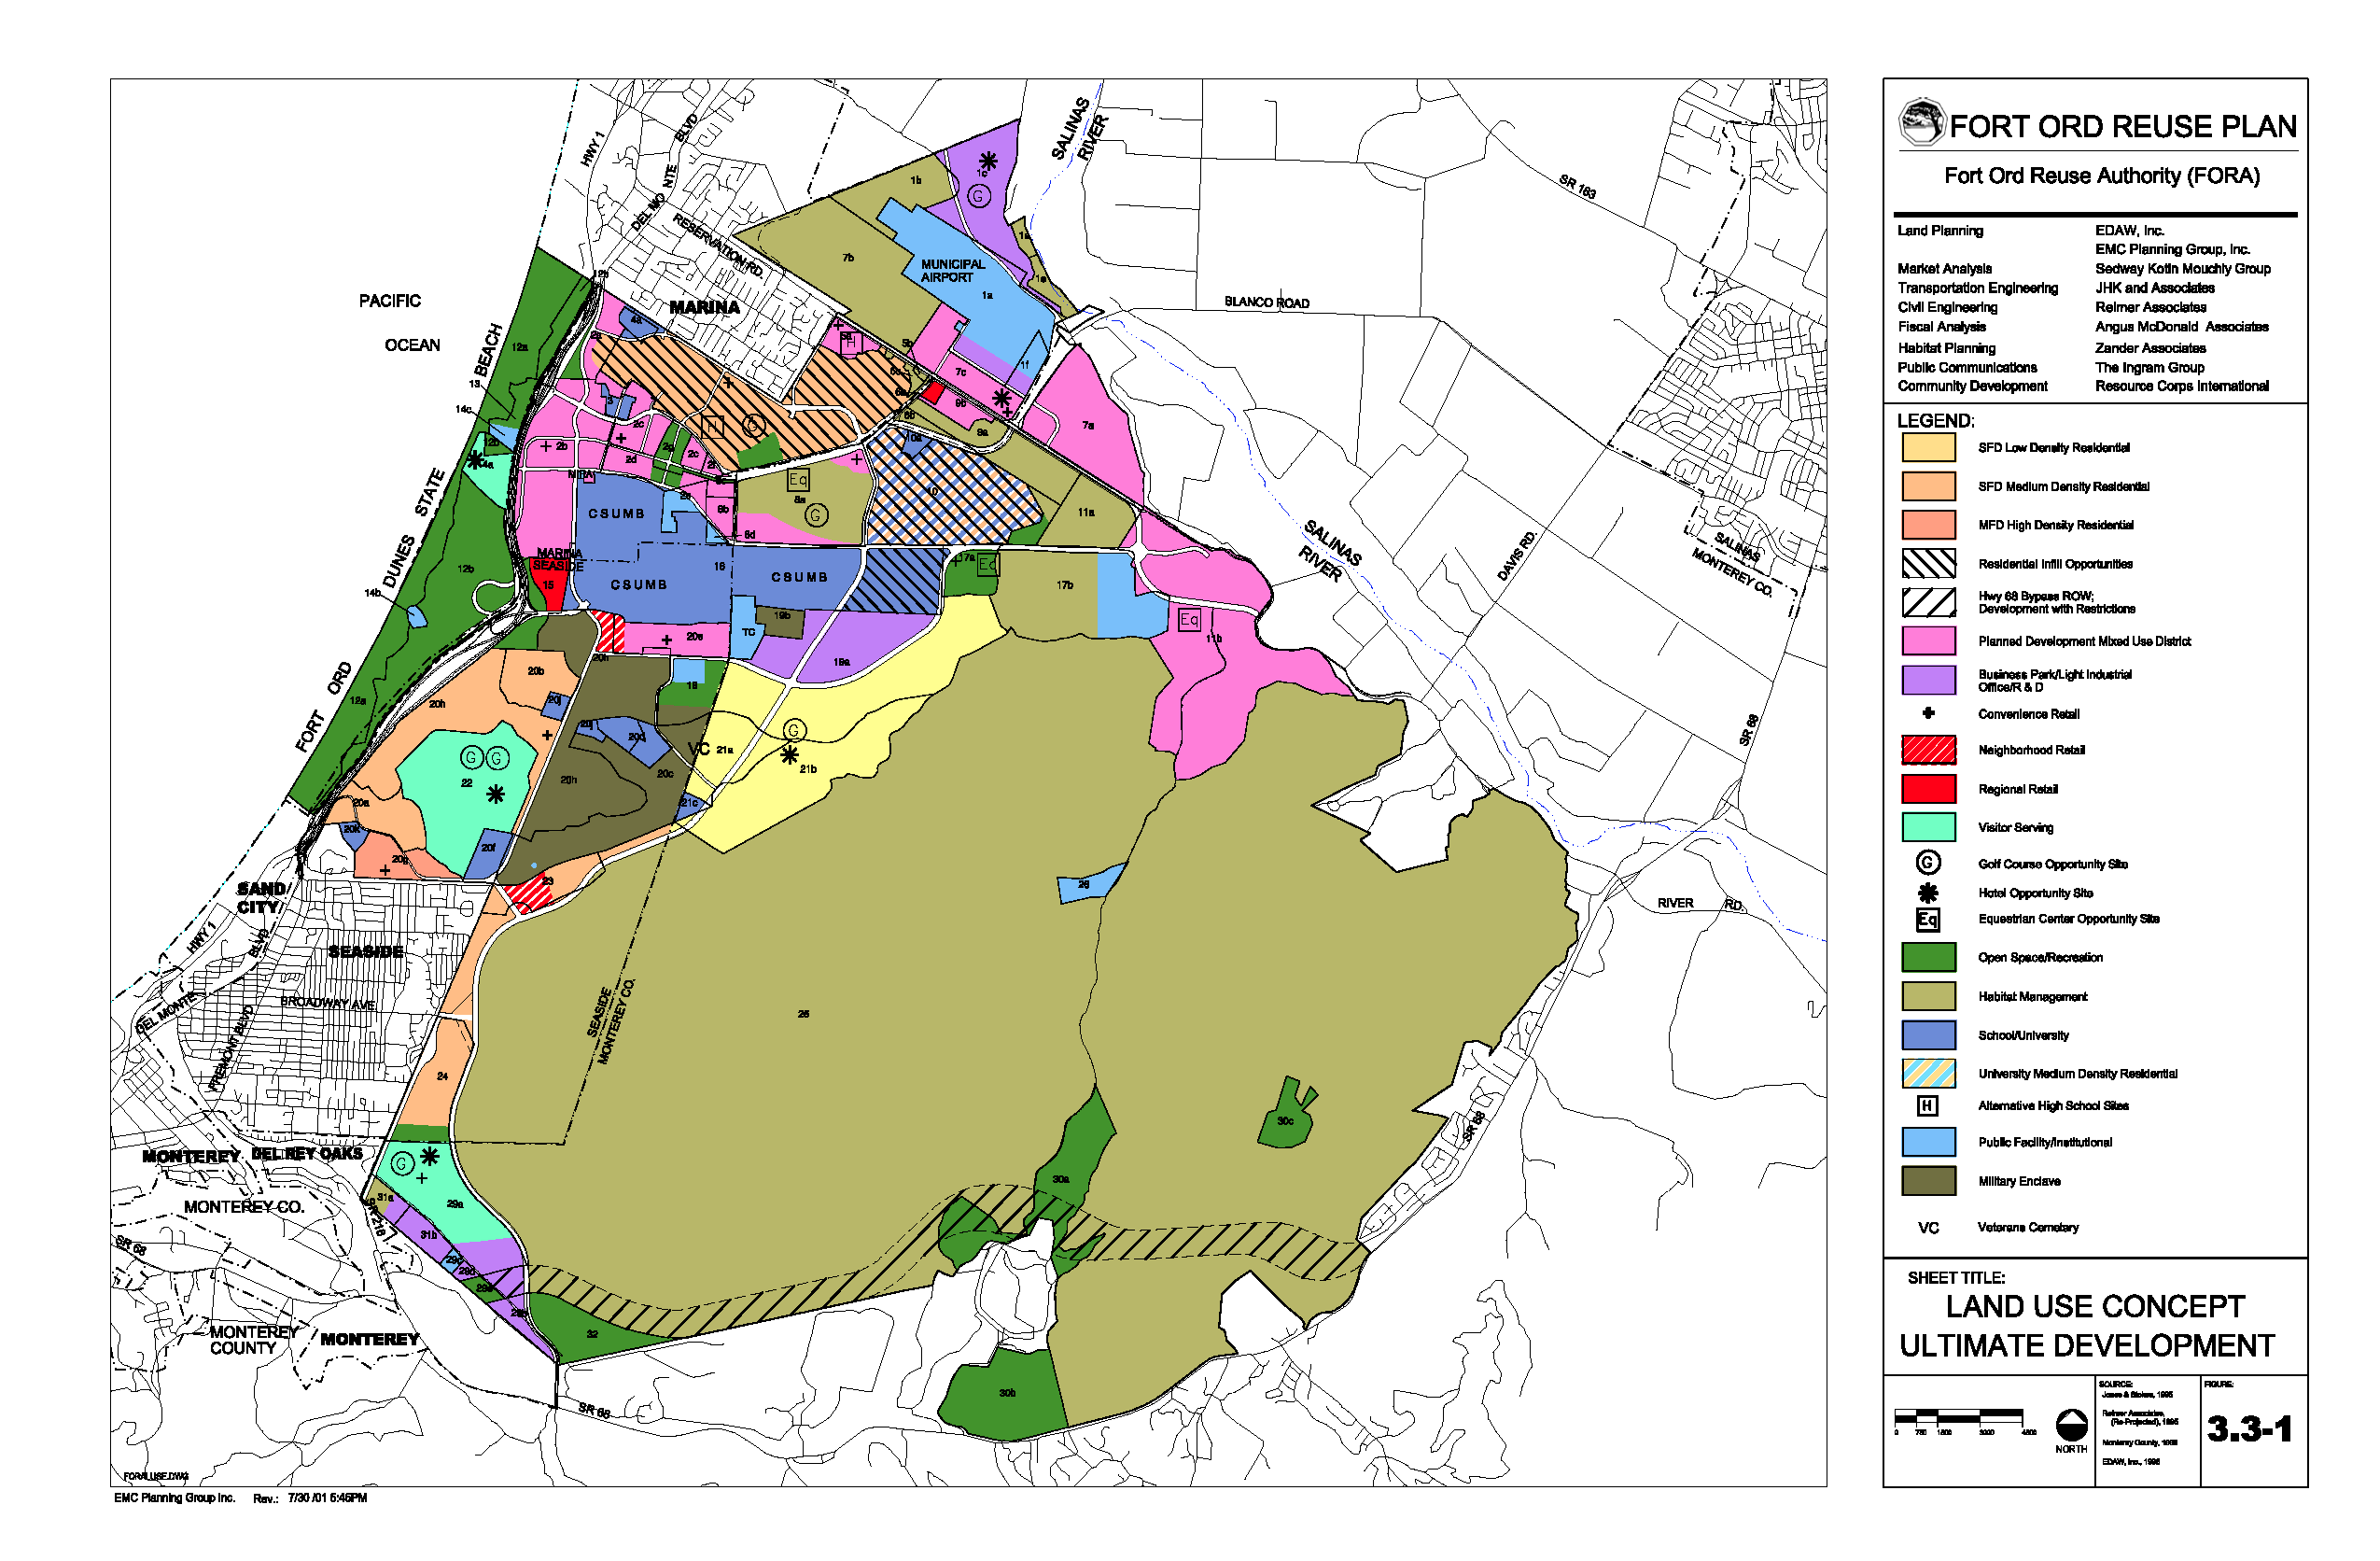
| 12:16, 28 March 2013 | FORA Map.pdf (file) | 917 KB | Aimeet | 1 | ||
| 12:26, 28 March 2013 | FORA Capital Improvement Program.pdf (file) | 1.36 MB | Aimeet | 1 | ||
| 14:06, 28 March 2013 | FORA Map.png (file) |  |
220 KB | Aimeet | 1 | |
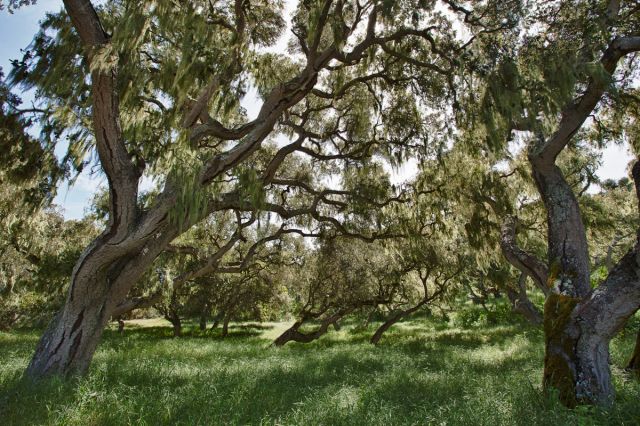
| 14:34, 28 March 2013 | OakWoodlandsFortOrd.gif (file) |  |
94 KB | Elizabethg | Oak woodlands on the Fort Ord National Monument, courtesy of the Bureau of Land Management. | 1 |
| 14:46, 28 March 2013 | SC dam.JPG (file) |  |
720 KB | Sheldonl | 3 | |
| 14:48, 28 March 2013 | SCdam.JPG (file) |  |
720 KB | Sheldonl | 1 | |
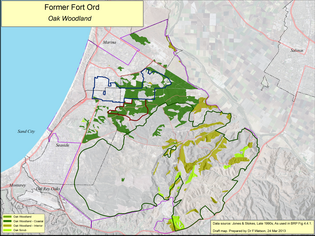
| 15:06, 28 March 2013 | ExistingOakWoodlandsFortOrd.gif (file) |  |
77 KB | Elizabethg | A map of existing oak woodlands on Fort Ord, courtesy of the Fort Ord Reuse Authority | 1 |
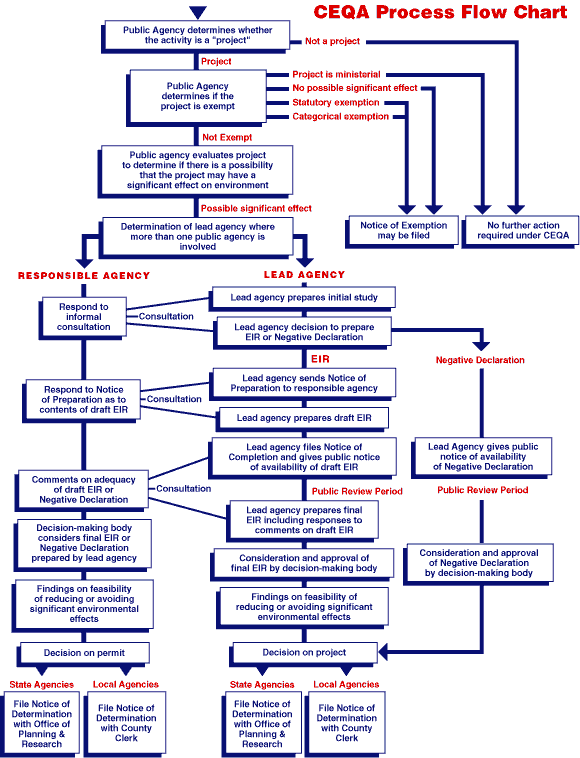
| 15:17, 28 March 2013 | CEQA process chart.gif (file) |  |
31 KB | Nicks | 1 | |
| 15:49, 28 March 2013 | OakWoodlands Watson.png (file) |  |
132 KB | Elizabethg | Oak Woodlands on Fort Ord created by Fred Watson March 2013(Based on late-1990s Jones & Stokes data. | 1 |
First page |
Previous page |
Next page |
Last page |