Difference between revisions of "Carneros Watershed: Slope"
From CCoWS Wiki
(→Metadata) |
(→Metadata) |
||
| (11 intermediate revisions by one user not shown) | |||
| Line 5: | Line 5: | ||
== Metadata == | == Metadata == | ||
| − | * | + | * Data Source: USGS, 1/3 arc second, Digital Elevation Model: See [[Carneros Watershed: Map of Elevation]] |
* Data analysis: ArcMap | * Data analysis: ArcMap | ||
* Map produced by: Kyle Stoner | * Map produced by: Kyle Stoner | ||
| Line 13: | Line 13: | ||
== Processing Steps == | == Processing Steps == | ||
| − | # | + | # ArcGIS -> Spatial Analyst Toolbar -> Surface Analysis -> Slope |
| − | # | + | # Input Surface: USGS 1/3 arc second DEM. DEM was projected so that x,y measurement units matched the vertical measurement unit. This projection change creates some visual distortion in the final image from the shift. |
| − | # | + | # Output Measurement: Slope was calculated in degrees. |
| − | + | # Z Factor: The Z-factor was set to 1 because the DEM was projected into UTM to match units of elevation. | |
| − | + | # Output Cell Size: Default value automatically used the input cell size. | |
| − | + | # Output Raster: name and location of slope raster to be created. | |
| − | + | # Color ramp was set to "Partial Spectrum" with 9 classes ranging from 0-75 degrees. | |
== Links == | == Links == | ||
| − | * [[Maps of the | + | * [[Maps of the Carneros Watershed]] |
Latest revision as of 15:35, 10 February 2011

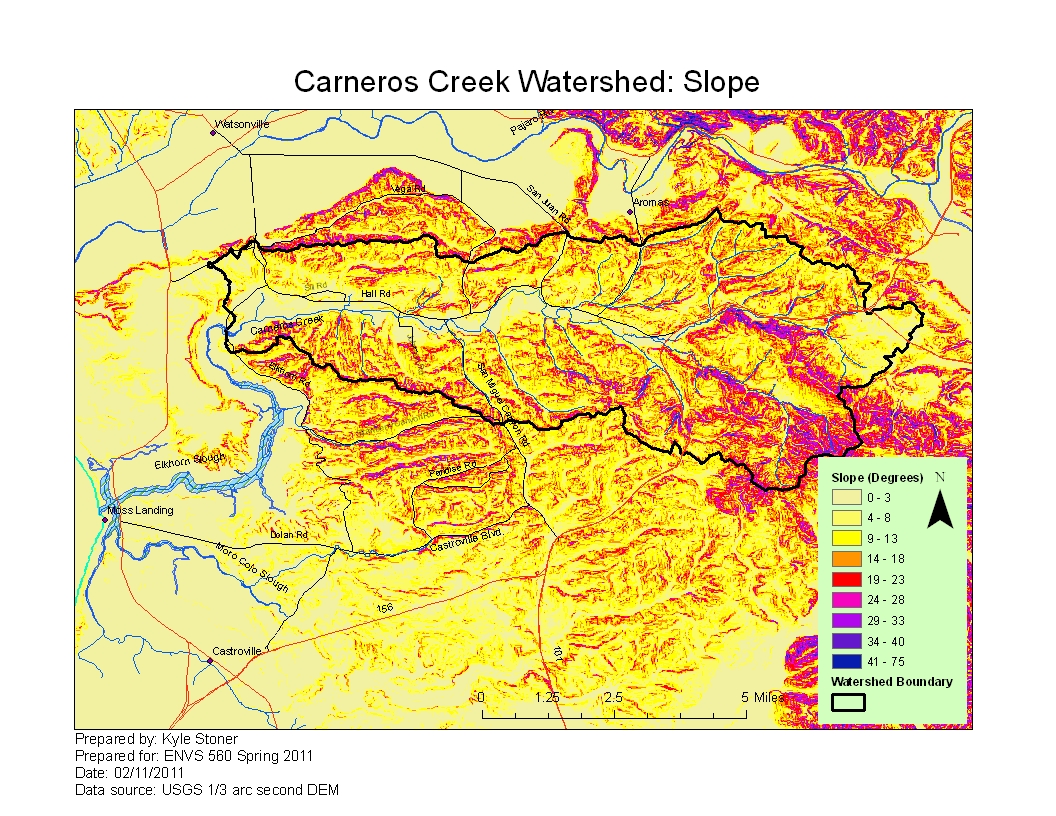
Metadata
- Data Source: USGS, 1/3 arc second, Digital Elevation Model: See Carneros Watershed: Map of Elevation
- Data analysis: ArcMap
- Map produced by: Kyle Stoner
- Coordinate system: UTM Zone 10
- Datum: NAD 83
Processing Steps
- ArcGIS -> Spatial Analyst Toolbar -> Surface Analysis -> Slope
- Input Surface: USGS 1/3 arc second DEM. DEM was projected so that x,y measurement units matched the vertical measurement unit. This projection change creates some visual distortion in the final image from the shift.
- Output Measurement: Slope was calculated in degrees.
- Z Factor: The Z-factor was set to 1 because the DEM was projected into UTM to match units of elevation.
- Output Cell Size: Default value automatically used the input cell size.
- Output Raster: name and location of slope raster to be created.
- Color ramp was set to "Partial Spectrum" with 9 classes ranging from 0-75 degrees.