California Rapid Assessment Method (CRAM)
A summary of one of the Technical Tools used in Environmental Science and Management within California's Central Coast Region created by ENVS 560/L Watershed Systems class at CSUMB.

Contents
- 1 Summary
- 2 Why use CRAM?
- 3 CRAM Procedure
- 3.1 Step 1: Assemble Background Information
- 3.2 Step 2: Classify the Wetland
- 3.3 Step 3: Identify Assessment Window
- 3.4 Step 4: Estimate Assessment Area (AA)
- 3.5 Step 5: Pre-Fieldwork Stressor Identification
- 3.6 Step 6: Fieldwork Stressor Identification
- 3.7 Step 7: Calculate CRAM Score
- 3.8 Step 8: Upload Results
- 4 Attributes
- 5 Examples
- 6 Links
- 7 References
- 8 Disclaimer
Summary
California Rapid Assessment Method (CRAM) is a standardized approach to monitor and assess the ecological conditions of wetlands California's wetland resources.[2][3] CRAM is represented as a single score that reflects the wetland's condition and stressors based on metrics of landscape and buffer condition, hydrology, biotic structure, and physical structure.[2] The score ranges from the lowest possible score of 25 to a perfect score of 100.[4] CRAM is considered "rapid" because it can take less than three hours for only two or three practitioners to asses a representative wetland area.[5]
CRAM was developed by the California Wetland Monitoring Workgroup (CWMW), a group that consists of federal, state, and local agency personnel and scientists, NGO scientists, and consultants.[5][6] CRAM supports the State’s Wetland and Riparian Area Monitoring Plan (WRAMP) and is supported and endorsed by the California Water Quality Monitoring Council.[6]
Why use CRAM?

CRAM has been adopted in California because it is consistent, scientifically defensible, and affordable.[7] There are several public and private fund investments aimed at the protection, restoration, and management of California wetlands, but the impact of these investments are difficult to evaluate because there are often inconsistencies in data collections and quality control.[7] With CRAM, wetland health can be compared and monitored under consistent conditions. Additionally, the results of the monitoring are hosted on the EcoAtlas website, making records of CRAM data available to analysts and decision makers.[8][5]
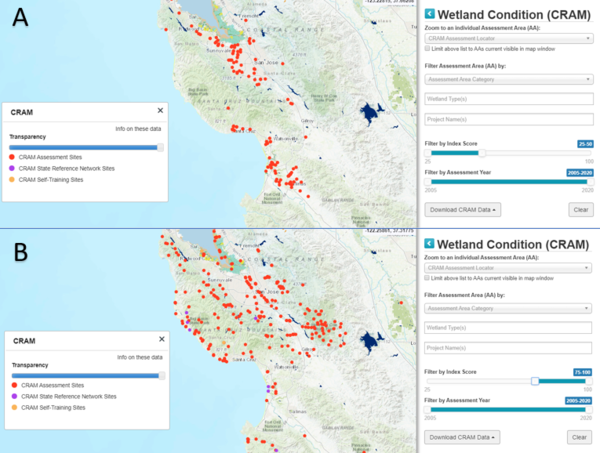
The EcoAtlas website is easy to use and offers a variety of filters. The visitor is able to narrow the search to a range of years, a range of scores, or directly look up the wetland of interest. Additionally, there are three site categories with a color attributed to each:
- State Reference Network Site: Purple
- Self-Training Site: Orange
- Assessment Sites: Red
The Reference Network sites are used for calibrating CRAM to different wetland types. The Self-Train sites are used for practitioners to learn the method. Assessment Sites include any site in California that has been assessed. Monterey County contains at least one of each site.[7]
CRAM Procedure
There are eight steps to use CRAM.
Step 1: Assemble Background Information
Background information that is helpful for aiding CRAM assessments are: management objectives, history, known or expected stressors, and general ecological character of the wetland.[7] Useful sources of background information include: USGS topographic quadrangles, National Wetlands Inventory (NWI), State Wetlands Inventory, road maps, maps of geology/soils/vegetation/land use, aerial imagery, data from the California Natural Diversity Database (CNDDB), and reports from water districts, flood control districts, open space districts, federal, state, and local agencies such as Special districts in the Monterey Region.[7]
Step 2: Classify the Wetland
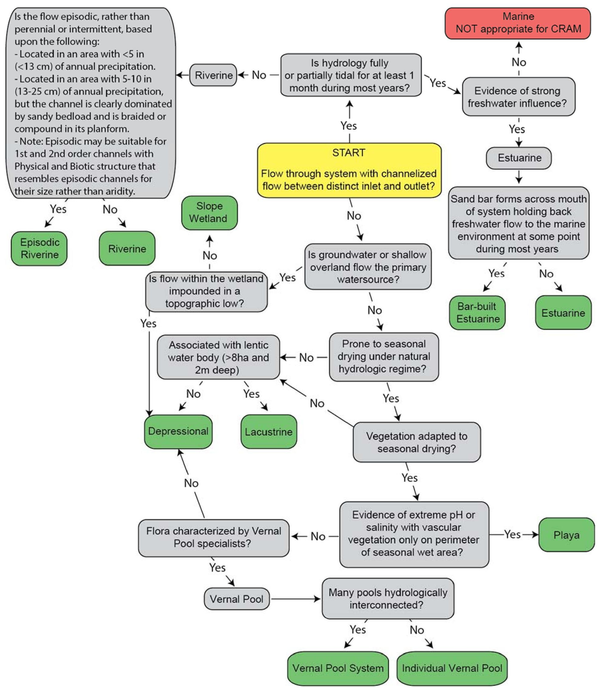
To make CRAM applicable to virtually all of California's diverse range of wetlands, modules or types were created.[7] There are six major types, four of which have sub-types.[7]

Although wetland types can change over time, through either natural or anthropogenic causes, wetlands should be evaluated by their current type.[7] Past or future changes should not be considered when identifying the CRAM type to use.[7] If there is a change in wetland type, it will be documented in the stressor checklist portion of CRAM to identify if the wetland is being stressed by the conversion.[7]
CRAM was originally created to assess vegetated wetlands, so CRAM may not be as effective at describing wetland health if the wetland is non-vegetated.[7] Such non-vegetated wetlands would include tidal flats or mudflats.[7] If CRAM is to be used on a non-vegetated wetland, it should be noted in the Basic Information page and the Plant Community metric.[7]
Each wetland type has its own recommended Assessment Area (AA).[7] For a wetland to be considered as an assessable wetland under CRAM, there must be enough of the wetland area to include one or more AA.[7]
| CRAM Wetland Types | CRAM Sub-types | Recommended AA Size |
|---|---|---|
| Riverine | Confined Riverine | Recommended length is 10x average bankfull channel width; maximum length is 200 m; minimum length is 100 m. AA should extend laterally (landward) from the bankfull contour to encompass all the vegetation (trees, shrubs vines, etc.) that probably provide woody debris, leaves, insects, etc. to the channel and its immediate floodplain; minimum width is 2 m. |
| Non-confined Riverine | ||
| Depressional | Individual Vernal Pools | There are no size limits. |
| Vernal Pool Systems | Preferred size is <10 ha (about 300m x 300m; shape can vary); there is no minimum size so long as there are between 3 and 6 pools. If the system has between 3 and 6 pools, assess all of them. If there are more than 6 pools, select 6 that represent the range in size of pools present on the site. | |
| Depressional | Preferred size is 1.0 ha (a 56 m radius circle or about 100m x 100m, but shape can vary); Maximum size is 2.0 ha (an 80 m radius circle or about 140m x 140m, but shape can vary); There is no minimum size. | |
| Playas | No sub-type | Preferred size is 2.0 ha (about 140m x 140m, but shape can vary); Minimum size is 0.5 ha (about 75m x 75m). |
| Estuarine | Perennial Saline Estuarine | Preferred size and shape for estuarine wetlands is a 1.0 ha circle (radius about 55m), but the shape can be non-circular if necessary to fit the wetland and to meet hydro-geomorphic and other criteria. The minimum size is 0.1 ha (about 30m x 30m). |
| Perennial Non-saline Estuarine | ||
| Bar-Built Estuarine | Maximum size is 2.25 ha (about 150 m x 150 m, but shape can vary), The minimum size is 0.1 ha (about 30m x 30m). | |
| Lacustrine | No sub-type | Preferred size is 2.0 ha (about 140m x 140m, but shape can vary); Minimum size is 0.5 ha (about 75m x 75m). |
| Slope | Seeps and Springs | Preferred size is 0.50 ha (about 75m x 75m, but shape can vary); there is no minimum size (least examples can be mapped as dots). |
| Forested Slope | ||
| Wet Meadows | Preferred size is 1.0 ha (about 140m x 140m, but shape can vary); Maximum size is 2.0 ha; minimum size is 0.1 ha (about 30m x 30m). |
Step 3: Identify Assessment Window
The Assessment Window is the window of time each year when CRAM should be conducted.[7] Generally, the CRAM Assessment Window occurs during the main growing season.[7] A typical wetland Assessment Window falls between March and September, but can vary with latitudes and altitudes.[7] Because each Assessment Window is unique to each wetland, local or regional cues may be needed to determine when the window opens and closes each year.[7]
Step 4: Estimate Assessment Area (AA)
Although an AA may include the entire wetland, in most cases the AA is only a portion of the whole wetland.[7] It is important to ensure that the AA only includes one wetland type, even if multiple wetlands are contiguous with or nested within each other.[7] The AA is estimated, then verified in the field.[7]
Step 5: Pre-Fieldwork Stressor Identification
Before conducting fieldwork, stressors should be identified using existing documentation such as aerial photography and reports.[7] If aerial photography is used, the maximum spatial resolution that should be used is 3 meters.[7] An example of appropriate aerial photography would be NAIP.[7]
Step 6: Fieldwork Stressor Identification
Each module has a corresponding CRAM field book.[7] Each CRAM field book contains a Stressor Checklist.[7] Each item on the checklist can be checked as “present” or “significant negative effect on AA”.[6] The Stressor Checklist has four sections corresponding to each CRAM attribute: landscape context, hydrology, physical structure, and biotic structure.[7]
The Stressor Checklist is based on four assumptions:
- Stressors help explain CRAM scores[7]
- The wetland condition declines as the number of stressors acting on the wetland increases[7]
- Increasing the intensity or the proximity of the stressor results in a greater decline in condition[7]
- Continuous or chronic stress increases the decline in condition[7]
Step 7: Calculate CRAM Score
During the fieldwork, a score is given to each of the four attributes (landscape context, hydrology, physical structure, and biotic structure.)[7] The final CRAM score is calculated by taking the average of the four attributes, where the final score is rounded to the nearest whole percentage.[7]
Step 8: Upload Results
The final step in CRAM is to upload the results to the CRAM database.[7]
Attributes
Landscape context, hydrology, physical structure, and biotic structure are the four attributes that CRAM uses to asses wetland health.[7]
Landscape context
Landscape context, also considered as buffer and landscape context, is the are around the wetland.[7] The reason the buffer and landscape are included in CRAM is because the adjacent environment can protect the wetland from natural or anthropogenic stress, so it is a necessary measure of wetland condition.[7][10] The landscape or buffer surrounding the wetland can help filter pollutants, act as a refuge for wetland wildlife during flooding, prevent people and their pets from trampling or otherwise disrupting the wetlands, moderate predation by ground-dwelling terrestrial predators, and act as an obstruction of terrestrial corridors of invasion preventing non-native species (such as an Invasive Species of California) from invading the wetland.[7] Areas that have been converted to other uses (recreational, agricultural, etc.) may no longer provide buffer functions for the wetland.[7]
Hydrology
Hydrology includes the sources, quantities, and movements of water, their magnitude, duration, and intensity as well as the transport and fates of water-borne materials, particularly sediment as bed load and suspended load.[7][10] It is considered the most important factor in determining the wetland condition.[7][10] The hydrology can affect a wetland's physical processes such as nutrient cycling, sediment entrapment, and pollution filtration.[7]
Physical Structure
The physical structure is the spatial organization of living and non-living surfaces that provide habitat for biota.[7] The physical characteristics of a wetland largely control the distribution and abundance of organisms.[7]
Biotic Structure
The biotic structure of a wetland includes all organic matter such as vegetation, coarse detritus, and algae.[7][10] The biotic structure is important in assessing wetland condition because it influences the quantity, quality, and spatial distribution of water and sediment.[7]
Examples
- Due to the use of CRAM by the Central Coast Wetlands Group, the Santa Rita Creek Watershed formed a wetland restoration project that increased the wetland's score from 39 in 2014 to 58 in 2015.[11]
- In 2016, the Santa Clara Valley Water District based their Upper Pajaro River Watershed Condition Assessment D5 Project on CRAM assessments. [12]
- In Elkhorn Slough's 2009 and 2015 Assessment, CRAM was utilized to determine which areas in the wetland need the most immediate attention and analyze the impact of restoration activities.[13]
- CRAM is being used by the Greater Monterey County Regional Water Management Group (RWMG) to implement and monitor the Greater Monterey County Integrated Regional Water Management (IRWM) Program.[14]
Links
- The Molera Wetland
- Frog Pond Wetland Preserve
- Locke-Paddon Wetland Community Park
- Elkhorn Slough
- Carmel River
- Gabilan Creek
- Salinas River
- Carmel River Lagoon
References
- ↑ California Rapid Assessment Method logo https://www.sfei.org/news/california-rapid-assessment-method-wetlands-cram-updates#sthash.c5j6Sfe7.dpbs
- ↑ 2.0 2.1 California Creates Rapid Assessment Method for Wetland Protection https://www.epa.gov/wetlands/california-creates-rapid-assessment-method-wetland-protection
- ↑ California Rapid Assessment Method Website https://www.cramwetlands.org/
- ↑ How do we assess wetland health? https://mywaterquality.ca.gov/eco_health/wetlands/condition/cram.html
- ↑ 5.0 5.1 5.2 About California Rapid Assessment Method https://www.cramwetlands.org/about
- ↑ 6.0 6.1 6.2 CRAM Episodic River Module https://www.cramwetlands.org/sites/default/files/CRAM_Worksheets_EpisodicRiverine_v1.0.pdf
- ↑ 7.00 7.01 7.02 7.03 7.04 7.05 7.06 7.07 7.08 7.09 7.10 7.11 7.12 7.13 7.14 7.15 7.16 7.17 7.18 7.19 7.20 7.21 7.22 7.23 7.24 7.25 7.26 7.27 7.28 7.29 7.30 7.31 7.32 7.33 7.34 7.35 7.36 7.37 7.38 7.39 7.40 7.41 7.42 7.43 7.44 7.45 7.46 7.47 California Rapid Assessment Method for Wetlands User’s Manual Version 6.1 https://www.cramwetlands.org/sites/default/files/2013-04-22_CRAM_manual_6.1%20all.pdf
- ↑ About EcoAtlas https://www.ecoatlas.org/about/
- ↑ California Rapid Assessment Method Flowchart https://www.cramwetlands.org/sites/default/files/UPDATED%20CRAM%20Flowchart_July2016.pdf
- ↑ 10.0 10.1 10.2 10.3 CRAM Fact Sheet https://www.cramwetlands.org/sites/default/files/2008-11_Calif%20CRAM%20Factsheet%20Nov10%20HiRes.pdf
- ↑ Santa Rita Creek Watershed Project
- ↑ Upper Pajaro River Watershed Condition Assessment
- ↑ Monterey Bay National Marine Sanctuary State of Sanctuary Resources: Estuarine Environment
- ↑ Section K of the Greater Monterey County Integrated Regional Water Management Plan
Disclaimer
This page may contain students' work completed as part of assigned coursework. It may not be accurate. It does not necessarily reflect the opinion or policy of CSUMB, its staff, or students...