Desalination in California's Central Coast Region
A watershed-related issue examined by the ENVS 560/L Watershed Systems class at CSUMB.
Contents
Summary
Desalination is a constant consideration as an alternative water supply in Central California, where water for agricultural and residential use is in short supply.[1] In 2009, the California State Water Resources Control Board issued a Cease and Desist Order, requiring CalAm to reduce its pumping from the Carmel River by 70% by 2016 [2]. The Carmel River is the primary water source for the region, so alternative water sources are necessary. The Central Coast also relies heavily on groundwater supplies; however, problems with seawater intrusion make this an unsustainable alternative. As a result, many proposals for desalination facilities have been submitted as a possible solution to the water gap. [3] The number of operational desalination facilities in California nearly doubled in the period between 2006 and 2013. [4] A drought relief package on Governor Jerry Brown's desk proposes $6 million for desalination projects in the state. [5]
Desalination Technologies
Despite the increasing demand for potable water making desalination a more viable water supply option for many municipalities, concerns over the energy intensity of standard desalination technologies persist. A number of alternative processes and energy sources for desalination are in development.
Standard
Other
- Solar Powered [8]
- portable solar [9]
- Reverse Osmosis - Pressure Retarded Osmosis [10]
- Fertilizer Drawn Forward Osmosis [11]
Unit conversions
Desalination plants are generally rated in terms of Million Gallons per Day (MGD), whereas water supply planning is often accounted in Acre Feet per Year (AFY).
1 MGD = 1,120 AFY
| MGD | AFY |
|---|---|
| 0.5 | 560 |
| 1 | 1120 |
| 2 | 2240 |
| 5 | 5600 |
| 10 | 11,200 |
Desalination Facilities in the Central Coast
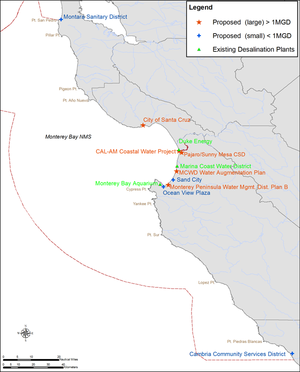
Existing
- Cambria - Cambria Community Services District, 0.43 MGD, permitted May 15, 2014 [12],operational November 2014 [13]
- Marina - Marina Coast Water District (MCWD) 0.3 MGD (not currently operational) [3]
- Moss Landing - Duke Energy, 0.48 MGD, used for power plant operations [3]
- Monterey - Monterey Bay Aquarium,[14] 0.04 MGD, used for toilets and other on-site uses [3]
- Sand City - City of Sand City/CalAm, 0.27 MGD [15]
- Santa Barbara - City of Santa Barbara, long-term standby mode [16]
Abandoned
- Marina - Regional Water Project (also known as 'Regional Desalination Project'?). Partners: Cal-Am, MCWD, MCWRA
Proposed
- Santa Cruz - City of Santa Cruz, 2.5 MGD, project stalled [17] [4]
- Monterey - Ocean View Plaza (private development) [18]
- Sand City - Monterey Peninsula Water Management District (MPWMD), 3-7.5 MGD [19]
- Marina - Monterey Peninsula Water Supply Project (MPWSP), 9 MGD, slant well testing phase [20]
- Marina - Marina Coast Water District (MCWD), 2.4 MGD [21]
- Moss Landing - DeepWater Desal, 22 MGD [22] [4] [21]
- Moss Landing - The People's Moss Landing Water Desalination Project, 12 MGD [21] [23]
Other California Desalination Facilities
- Carlsbad - San Diego County Water Authority and Poseidon Water, operational, opened December 2015, 50 MGD [24] [4]
- Huntington Beach - Poseidon Water, final permitting phase, scheduled to be operational by 2018, 50 MGD [25] [4]
- Fresno County - WaterFX (solar desal), operational, 0.014 MGD in March 2014, goal to produce 4 MGD. [26] [8]
Main Issues
Impacts to the Marine Environment
The main potential impacts from desalination to the marine environment are impingement and entrainment of marine organisms at the water uptake as well as potential harm from the disposal of highly concentrated salt brine back into the environment [27]. Impingement occurs when fish and other organisms are trapped against inflow screens, which often results in death. Entrainment is when organisms are drawn into the facility, which are exposed to high pressures and temperatures.
Impacts to the marine environment are of particular concern in the Central Coast because the proposed facilities will operate within the Monterey Bay National Marine Sanctuary (MBNMS). The mission of the MBNMS is to protect natural resources and to implement their mission. Three of the Sanctuary's regulations are related directly to preventing impacts from desalination [28]: 1. "prohibition on discharging or depositing any material within Sanctuary boundaries", 2. "discharging materials outside of the boundaries, which subsequently enter Sanctuary waters and negatively impact MBNMS resources", and 3. "prohibition on activities that cause alteration of the seabed".
Marine impacts can be avoid or minimized with careful planning and mitigation measures. Subsurface intakes can minimize impingement and entrainment better than traditional open ocean intake methods [28]. Siting projects away from sensitive habitat or highly productive areas can also reduce the impact. To reduce impacts from brine discharge, it is recommended the brine water be diluted to a salinity of less than 5% above ambient concentration at the point of discharge [29].
Energy Consumption

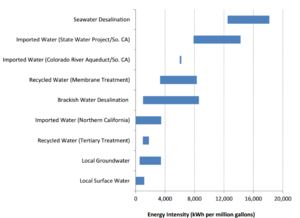
The proposed desalination technologies for the Central Coast are energy intensive. Producing a million gallons of desalinated seawater uses about 15,000 kWh [30], which is equivalent to the energy use of 913 California homes per day [31]. Most of the total energy use goes towards the reverse osmosis process (70%), while pre- and post-treatment and pumping account for 13% each [30]. Pumping water from the ocean to the plant is an additional 7%.
Greenhouse Gas Emissions
The high energy consumption of desalination results in high carbon dioxide emissions. Most projects, such as the Monterey Peninsula Water Supply Project, will tap into the existing power grid. As the Central Coast transitions to renewable power sources, desalination emission estimates may decrease. Some of the theoretical emissions associated with some of the proposed desalination plants in the Central Coast are below [30]. As a reference, 1 MMT of CO2 emissions is equivilent to about one year of electricity use by 193,000 average California households [32].
| Project | Location | Capacity (MGD) | Energy Use (MWh/day) | Emissions (MMT CO2e/yr) |
|---|---|---|---|---|
| City of Santa Cruz, Soquel Creek Water District | Santa Cruz | 5 | 75 | 0.007 |
| Monterey Peninsula Water Management District | Del Monte Beach, Monterey | 2 | 30 | 0.0003 |
| California American Water | North Marina | 10 | 150 | 0.01 |
| Ocean View Plaza | Monterey | 0.25 | 3.8 | 0.003 |
Customer Rate Increase
The cost of desalination is falling, but remains an expensive alternative. Given the high construction and energy costs of desalination, customer water bills are expected to increase. For example, a typical customer should expect their water bills to increase by approximately 40% by 2018 if the proposed Monterey Peninsula Water Supply Project is approved[33]. Below is an estimate of what a typical customer will expect to pay with the implementation of the Monterey Peninsula Water Supply Project [33].
| Monterey Water Supply Project monthly bill estimate | |||||
|---|---|---|---|---|---|
| 2013 | 2014 | 2015 | 2016 | 2017 | 2018 |
| $75.74 | $79.86 | $88.42 | $97.27 | $97.38 | $106.73 |
Regulatory Agencies
Federal
- NOAA/Monterey Bay National Marine Sanctuary (MBNMS)
- National Marine Fisheries Service
- Environmental Protection Agency
- U.S. Coast Guard
- United States Fish and Wildlife Service
- U.S. Army Corps. of Engineers
- U.S. Army
- United States Bureau of Land Management
State
- California Coastal Commission
- Central Coast Regional Water Quality Control Board (CCRWQCB)
- State Water Resources Control Board
- California Department of Public Health
- California Department of Fish and Wildlife
- California Department of Boating and Waterways
- California Department of Parks and Recreation
- California Department of Transportation
- California Department of Water Resources
- California Public Utilities Commission
- California State Lands Commission
- California Energy Commission
Local and Regional
- Counties
- Local Coastal Programs
- Coastal Development Permits
- Cities
- Coastal Development Permits
- Monterey Bay Unified Air Pollution Control District
- Monterey Peninsula Water Management District (MPWMD)
References
- ↑ The Water Supply Gap, Monterey Peninsula Water Management District 2011
- ↑ Cease and Desist Order WR 2009-0060, SWRCB
- ↑ 3.0 3.1 3.2 3.3 Desalination feasibility study for the Monterey Bay Region 2006
- ↑ 4.0 4.1 4.2 4.3 4.4 State of Desal in California, Santa Cruz Sentinel
- ↑ How $1 billion in California drought plan would be spent, Santa Cruz Sentinel
- ↑ Desalination by reverse osmosis
- ↑ Forward osmosis desalination not energy efficient, Phys.org
- ↑ 8.0 8.1 WaterFX
- ↑ Remote project a proof of concept for eco-friendly desalination, Phys.org
- ↑ New desalination technology could answer state drought woes, Phys.org
- ↑ Research makes desalination cheaper and greener, Phys.org
- ↑ Notice of proposed increase in water rates to fund an emergency water supply project, Cambria Community Services District
- ↑ Cambria's emergency water supply project
- ↑ Monterey Bay Aquarium
- ↑ Sand City Water Supply Project
- ↑ Desalination project status, City of Santa Barbara
- ↑ City of Santa Cruz Water Department Desalination Project
- ↑ Ocean View Plaza Coastal Development Permit Application
- ↑ Desal response group, Sand City
- ↑ Environmental Assessment for the CalAm slant well test project 2014
- ↑ 21.0 21.1 21.2 Marina coast gets gangbusters for its own desal plant to supply Ft. Ord, Monterey County NOW
- ↑ DeepWater Desal
- ↑ The People's Moss Landing Water Desal Project
- ↑ Carlsbad Desalination Plant
- ↑ Seawater Desalination Huntington Beach Facility
- ↑ California drought: Solar desalination plant shows promise, SFGate
- ↑ Key issues in seawater desalination in California: Marine impacts, Pacific Institute 2013
- ↑ 28.0 28.1 Guidelines for Desalination Plants in the Monterey Bay National Marine Sanctuary 2010
- ↑ Desalination Plant Entrainment Impacts and Mitigation, SWRCB 2013
- ↑ 30.0 30.1 30.2 30.3 Key Issues for Seawater Desalination in California
- ↑ California statewide residential appliance saturation study
- ↑ 1MMT CO2 equivalents
- ↑ 33.0 33.1 CalAm customer rate impact estimates for proposed Monterey Peninsula Water Supply Project
Links
- CalAm Use of Carmel River Groundwater Basin
- Los Padres Reservoir Capacity Issues
- Carmel River
- The Carmel River Watershed
- Carmel Valley Aquifer
- Monterey Peninsula Groundwater Replenishment Project
- Seaside Groundwater Basin
- Salinas Valley Seawater Intrusion
- Desalination Laws (California Department of Water Resources]
- Local Coastal Programs in California's Central Coast Region
- California Water Plan 2013 Update (see Vol. 3, ch. 10 on desalination)
- Guidelines for Desalination Plants in the Monterey Bay National Marine Sanctuary (2010 report)
- California Desalination Planning Handbook (California Department of Water Resources, 2008)
- Desalination Feasibility Study for the Monterey Bay Region (2006)
- Seawater Desalination and the California Coastal Act (California Coastal Commission, 2004)
- National Academies Report in Brief: Desalination: A National Perspective (2008)
Disclaimer
This page may contain student work completed as part of assigned coursework. It may not be accurate. It does not necessary reflect the opinion or policy of CSUMB, its staff, or students.
